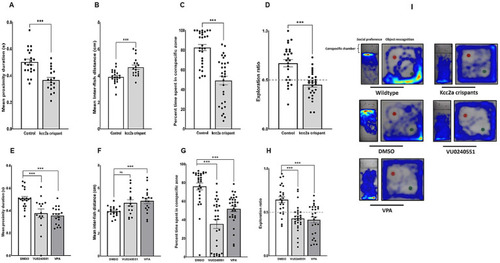
Alterations in social behaviors and cognitive performance in kcc2a crispants. Changes in shoaling behavior is shown as (A) mean proximity duration and (B) mean inter-fish distance (n = 4–7). Social preference is shown as (C) the percentage of time spent in the conspecific zone (n = 29–30), and (D) object recognition memory represented by exploration ratio (n = 25–28). The figure also depicts changes in (E,F) shoaling behavior (n = 15–20), (G) social preference (28–30), and (H) object recognition memory (n = 24–28) in fish exposed to VU 0240551 (a KCC2 blocker) and valproic acid (VPA). (I) Representative heat map of zebrafish larvae in social preference and object recognition tasks. The asterisks above data bars represent a significant difference vs. the control group at * p < 0.05, ** p < 0.01, and *** 0.001. “ns” indicates not significant (p > 0.05).

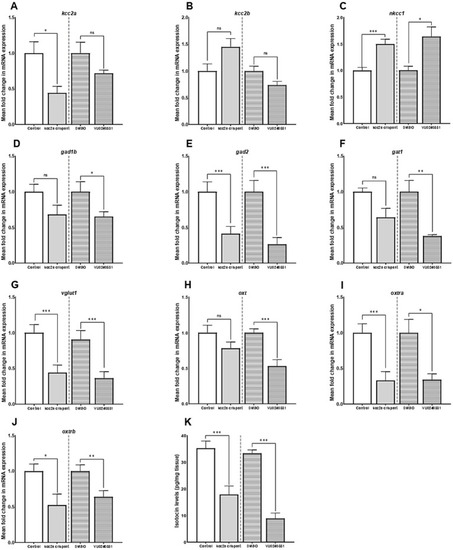
The mean fold change in the mRNA expression level of (A)kcc2a (slc12a5a), (B)kcc2b (slc12a5b), (C)nkcc1 (slc12a2), (D)gad1b (glutamate decarboxylase 1b), (E)gad2 (glutamate decarboxylase 2), (F)gat1 (GABA transporter 1, slc6a1a), (G)vglut1 (vesicular glutamate transporter 1, slc17a7a), (H)oxt,(I)oxtra, and (J)oxtrb genes (n = 5–7). (K) The whole-brain oxytocin (isotocin) levels between different experimental conditions (control vs. kcc2a crispants and DMSO-treated fish vs. KCC2 blocker VU 0240551, n = 4–6). The asterisks above data bars represent a significant difference vs. the control group at *p < 0.05, **p < 0.01, and ***p < 0.001. “ns” indicates not significant (p > 0.05).

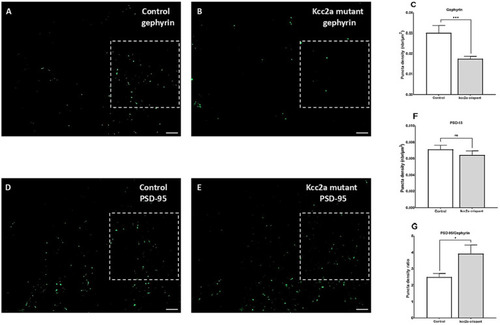
Defects of excitatory/inhibitory balance in the kcc2a KO larvae. 10 μm coronal sections of 21 dpf (A) control (N = 4, n = 12), (B)kcc2a crispants (N = 3, n = 9) stained with gephyrin, an inhibitory post-synaptic scaffolding protein and (C) quantification of gephyrin puncta density. (D) Coronal sections of 21 dpf control (N = 3, n = 9) larvae and (E)kcc2a crispants stained with PSD-95, an excitatory post-synaptic scaffolding protein and (F) quantification of PSD-95 puncta density. (G) PSD-95/gephyrin puncta density ratio. Scale bar 10 μm. N, number of larvae; n, number of sections. The asterisks above data bars represent a significant difference vs. the control group at *p < 0.05, **p < 0.01, and ***p < 0.001. “ns” indicates not significant (p > 0.05).

(A) Western blot analysis and (B) quantification of brain-derived neurotrophic factor (BDNF) protein levels in the zebrafish whole-brain (n = 3). Protein band intensities were normalized to total protein levels obtained via Ponceau staining represented as relative difference between experimental groups. The asterisks above data bars represent a significant difference vs. the control group at *p < 0.05, **p < 0.01, and ***p < 0.001. “ns” indicates not significant (p > 0.05).

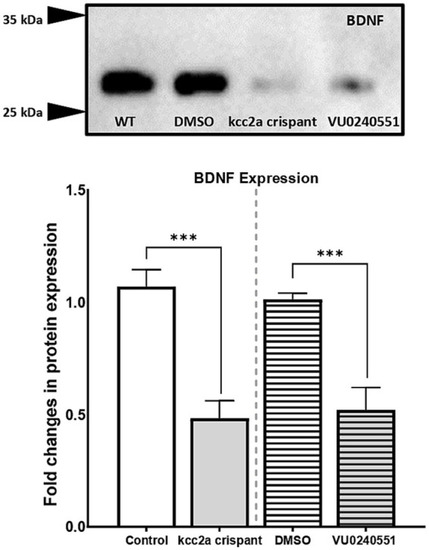
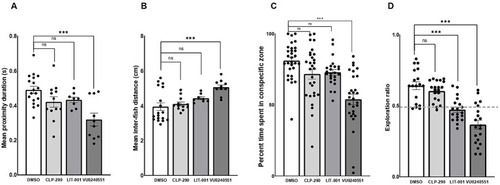
Effects of CLP-290, LIT-001, and VU 0240551 on social deficits, measured by time spent in proximity to shoal members (A), inter-individual distance (B), time spent in the conspecific zone (C), and memory impairment (D) in kcc2a crispants. Asterisks above the data bars indicate significant differences compared to the control group: *p < 0.05, **p < 0.01, and ***p < 0.001. “ns” indicates not significant (p > 0.05).

Acknowledgments
This image is the copyrighted work of the attributed author or publisher, and ZFIN has permission only to display this image to its users. Additional permissions should be obtained from the applicable author or publisher of the image. Full text @ Front. Mol. Neurosci.