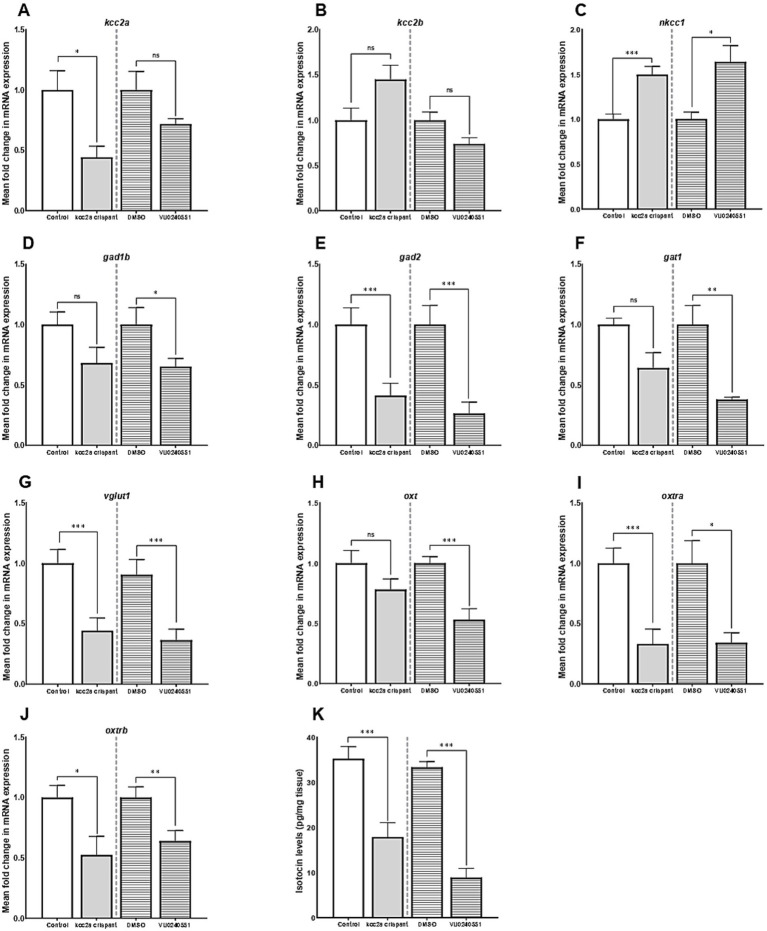
IMAGE

Figure 2

ID
ZDB-IMAGE-241030-26
Source
Figures for Naderi et al., 2024
Image
Figure Caption

Figure 2

The mean fold change in the mRNA expression level of (A)kcc2a (slc12a5a), (B)kcc2b (slc12a5b), (C)nkcc1 (slc12a2), (D)gad1b (glutamate decarboxylase 1b), (E)gad2 (glutamate decarboxylase 2), (F)gat1 (GABA transporter 1, slc6a1a), (G)vglut1 (vesicular glutamate transporter 1, slc17a7a), (H)oxt,(I)oxtra, and (J)oxtrb genes (n = 5–7). (K) The whole-brain oxytocin (isotocin) levels between different experimental conditions (control vs. kcc2a crispants and DMSO-treated fish vs. KCC2 blocker VU 0240551, n = 4–6). The asterisks above data bars represent a significant difference vs. the control group at *p < 0.05, **p < 0.01, and ***p < 0.001. “ns” indicates not significant (p > 0.05).

Acknowledgments
This image is the copyrighted work of the attributed author or publisher, and ZFIN has permission only to display this image to its users. Additional permissions should be obtained from the applicable author or publisher of the image. Full text @ Front. Mol. Neurosci.