FIGURE

Figure 2

ID
ZDB-FIG-241030-26
Publication
Naderi et al., 2024 - Unraveling the socio-cognitive consequences of KCC2 disruption in zebrafish: implications for neurodevelopmental disorders and therapeutic interventions
Other Figures
All Figure Page
Back to All Figure Page
Figure 2

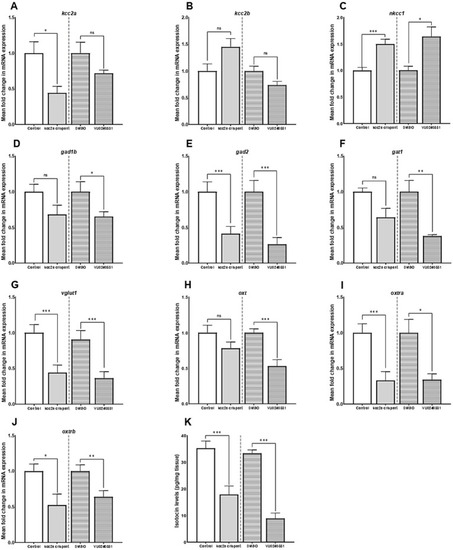
The mean fold change in the mRNA expression level of (A)kcc2a (slc12a5a), (B)kcc2b (slc12a5b), (C)nkcc1 (slc12a2), (D)gad1b (glutamate decarboxylase 1b), (E)gad2 (glutamate decarboxylase 2), (F)gat1 (GABA transporter 1, slc6a1a), (G)vglut1 (vesicular glutamate transporter 1, slc17a7a), (H)oxt,(I)oxtra, and (J)oxtrb genes (n = 5–7). (K) The whole-brain oxytocin (isotocin) levels between different experimental conditions (control vs. kcc2a crispants and DMSO-treated fish vs. KCC2 blocker VU 0240551, n = 4–6). The asterisks above data bars represent a significant difference vs. the control group at *p < 0.05, **p < 0.01, and ***p < 0.001. “ns” indicates not significant (p > 0.05).

Expression Data

Expression Detail
Antibody Labeling
Phenotype Data

Phenotype Detail
Acknowledgments
This image is the copyrighted work of the attributed author or publisher, and ZFIN has permission only to display this image to its users. Additional permissions should be obtained from the applicable author or publisher of the image. Full text @ Front. Mol. Neurosci.