
- Title
-
Standardizing CRISPR-Cas13 knockdown technique to investigate the role of cdh2 gene in pituitary development through growth hormone expression and transcription factors
- Authors
- Ventura Fernandes, B.H., Junqueira, M.S., MacRae, C., Silveira de Carvalho, L.R.
- Source
- Full text @ Front Endocrinol (Lausanne)
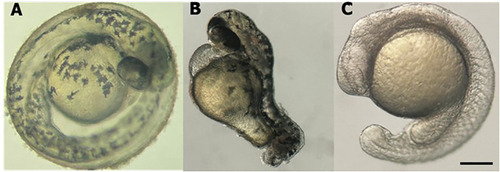
Stereomicroscope image of larval zebrafish at 48 hpf. PHENOTYPE:
|
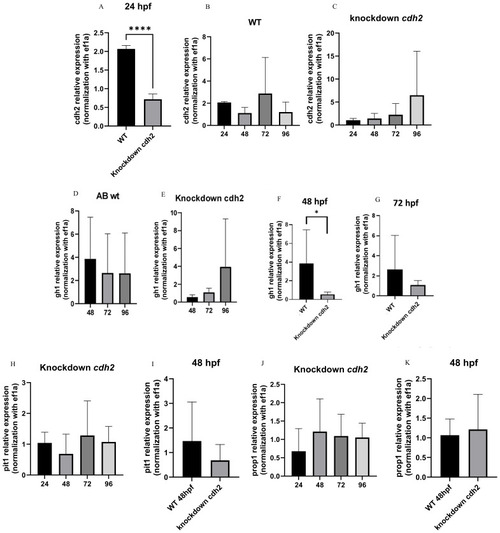
EXPRESSION / LABELING:
PHENOTYPE:
|

|