
IMAGE
Figure 3
- ID
- ZDB-IMAGE-241025-13
- Publication
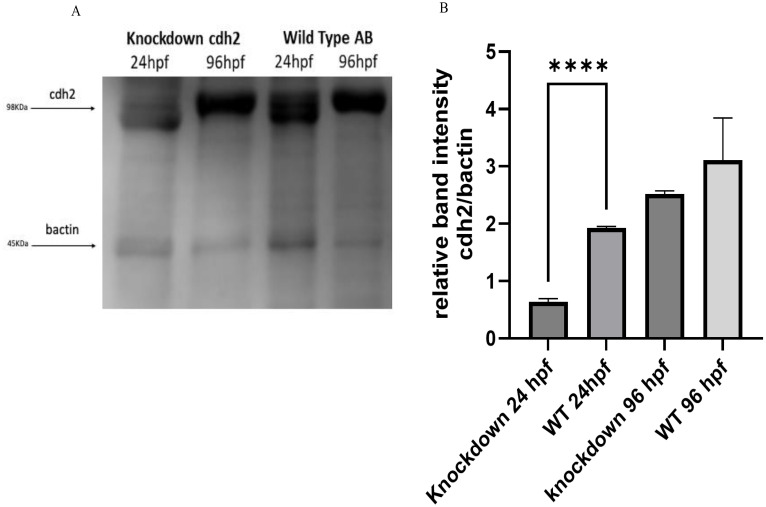
- Ventura Fernandes et al., 2024 - Standardizing CRISPR-Cas13 knockdown technique to investigate the role of cdh2 gene in pituitary development through growth hormone expression and transcription factors
- All Figures
- Figures for Ventura Fernandes et al., 2024
Image
|
Figure Caption
Figure 3
Acknowledgments
This image is the copyrighted work of the attributed author or publisher, and
ZFIN has permission only to display this image to its users.
Additional permissions should be obtained from the applicable author or publisher of the image.
Full text @ Front Endocrinol (Lausanne)