
Figure 2
- ID
- ZDB-IMAGE-241025-12
- Genes
- Publication
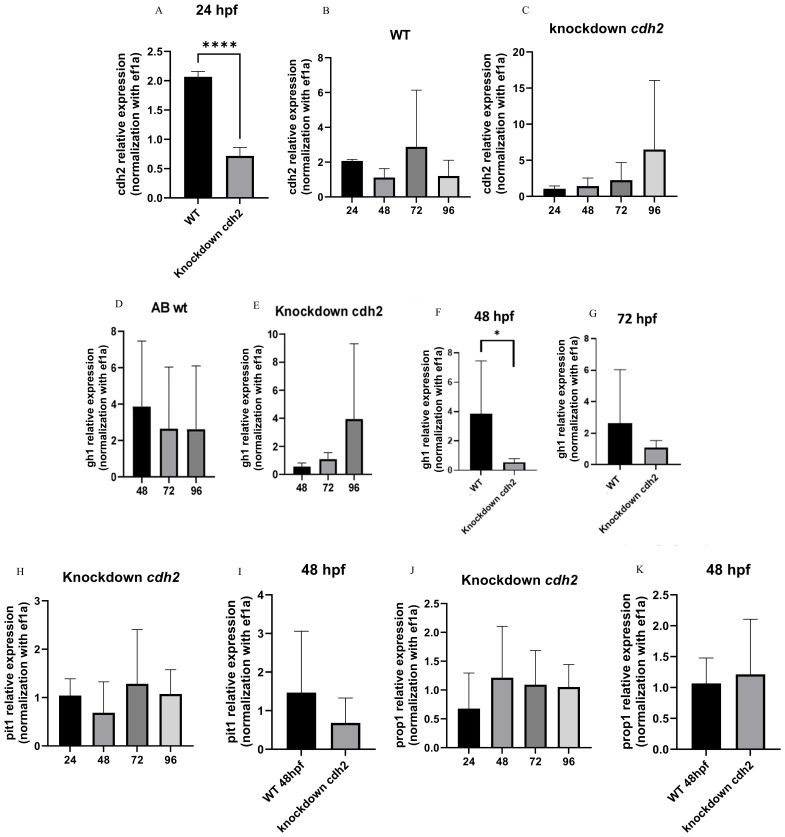
- Ventura Fernandes et al., 2024 - Standardizing CRISPR-Cas13 knockdown technique to investigate the role of cdh2 gene in pituitary development through growth hormone expression and transcription factors
- All Figures
- Figures for Ventura Fernandes et al., 2024
|
Figure 2