|
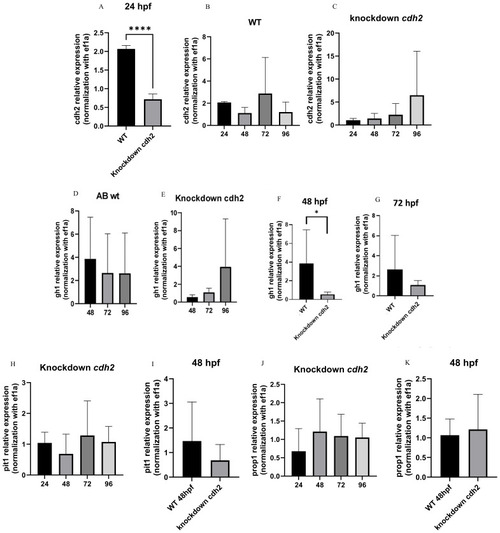
Gene expression graph (A)cdh2 at 24 hpf in WT and cdh2 knockdown larvae; (***p.<0,0001) (B)cdh2 temporal expression in WT larvae from 24 to 96 hpf; (C)cdh2 temporal expression in cdh2 knockdown larvae from 24 to 96 hpf; (D) Temporal expression of gh1 at 48, 72, and 96 hpf in WT larvae. (E) Temporal expression of gh1 at 48, 72, and 96 hpf in cdh2 knockdown larvae. (F) Expression of gh1 in cdh2 knockdown larvae compared to WT at 48 hpf (*p.<0.05). (G) Expression of gh1 in cdh2 knockdown larvae compared to WT 72 hpf (NS). (H)pit1 temporal expression in cdh2 knockdown larvae from 24 to 96 hpf. (I)pit1 expression at 48 hpf in cdh2 knockdown larvae compared to WT larvae (NS). (J)prop1 temporal expression in cdh2 knockdown larvae from 24 to 96 hpf. (K)prop1 expression at 48 hpf in cdh2 knockdown larvae compared to WT (NS).
|