FIGURE SUMMARY
Title

The zebrafish cerebellar neural circuits are involved in orienting behavior

Authors
Hosaka, S., Hosokawa, M., Hibi, M., Shimizu, T.
Source
Full text @ eNeuro

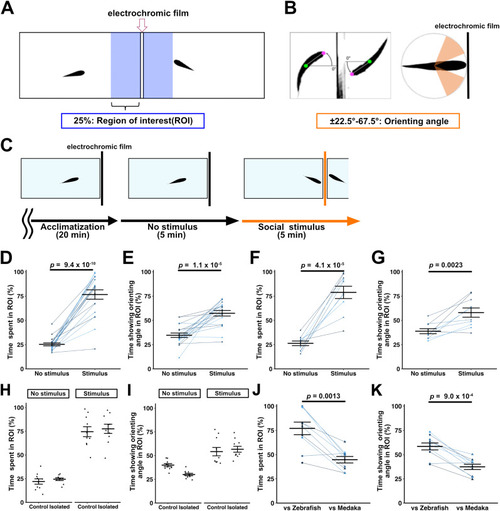
Orienting behavior of zebrafish toward conspecifics. A, Apparatus for orienting behavior. Two large tanks (L 9 × W 18 × H 6 cm, filled to 5.7 cm with water) were placed across a divider made of a light-dimming electrochromic film. The 25% area of the tank divider side was set as the ROI. B, Orienting angle. Behavior of looking at fish in the opposite tank at the head angle ±22.5–67.5° (orienting angle) from the direction perpendicular to the divider was considered orienting behavior. C, Time course of orienting behavior assay. Zebrafish were first placed in the tanks and allowed to swim ad libitum for 20 min to acclimate to the tanks (acclimatization). The swimming behavior was then recorded for 5 min when the divider was opaque (no-stimulus), followed by 5 min of swimming behavior when the divider was transparent (social stimulus). D, The percentage of the time in which zebrafish stayed in the ROI under no-stimulus or social stimulus conditions. E, The percentage of the time in which zebrafish exhibited the orienting angle in the ROI under no-stimulus or social stimulus conditions. Wild-type zebrafish stayed in the ROI and showed the orienting angles for a significantly longer period under the stimulus condition compared with the no-stimulus condition (n = 20 each in D; n = 20 each in E). F, G, The percentage of the time spent in the ROI and the percentage of the time that fish show the orienting angle when using a combination of standard (L 9 × W 18 × H 6 cm) and short (L 9 × W 9 × H 6 cm) tanks. Zebrafish behavior in the large tanks was analyzed. They stayed in the ROI and showed the orienting angle for a longer period under the stimulus condition than the no-stimulus condition (n = 10 each in F; n = 10 each in G). H, I, The percentage of the time spent in ROI and the percentage of the time showing orienting angles for isolated zebrafish reared with no other fish in sight until adulthood. Two large tanks were used. Isolated zebrafish stayed in the ROI and showed the orienting angles comparable with those of control zebrafish (n = 10 each in H; n = 10 each in I). J, K, Zebrafish orienting behaviors toward medaka. After analyzing the orienting behavior of zebrafish toward zebrafish, the orienting behavior of zebrafish toward medaka was analyzed. When medaka was used as a stimulus, zebrafish stayed in the ROI and showed the orienting angle for less time than when zebrafish was used as stimulus (n = 10 in J; n = 10 in K). See Extended Data Figure 1-1 for more details.

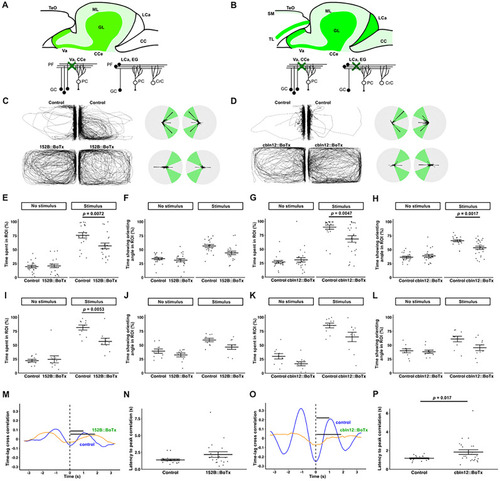
BoTx-mediated inhibition of GCs suppresses orienting behavior. Diagrams for the expression pattern of BoTx in adult transgenic zebrafish gSA2AzGFF152B;Tg(UAS:BoTxBLC-GFP) (A) and Tg(cbln12:Gal4FF); Tg(UAS:BoTxBLC-GFP) (B). CC, crista cerebellaris; CCe, corpus cerebelli; CrC, crest cell; EG, eminentia granularis; GL, granular layer; LCa, lobus caudalis cerebelli; ML, molecular layer; SM, stratum marginale; TeO, tectum opticum; TL, torus longitudinalis; Va, valvula cerebelli. Orienting behavior of 152B::BoTx, C, E, F, I, and J or cbln12::BoTx, D, G, H, K, and L, which express BoTx in GCs. Sibling zebrafish that did not express BoTx were used as controls. Representative traces and polar histograms for 152B::BoTx and its control (C) and cbln12::BoTx and its control (D). CH, Orienting behavior in two large tanks. The same type of test fish (either BoTx-expressing or control fish) were placed in both tanks. IL, Orienting behavior toward wild-type control fish. A combination of standard and short tanks was used. The test fish was placed in the standard tank, while wild-type fish was placed in the short tank (for visual stimulus). The orienting behavior of the test fish in the one tank (EH; large tank for IK, H) was analyzed. Percentages of the time spent in the ROI (E, G, I, K) and percentages of the time that fish showed the orienting angles in the ROI (F, H, J, L) are indicated. 152B::BoTx spent less time in the ROI in the two large tank (n = 20 each in E, F) and large/small tank (n = 10 each in I, J) assays. cbln12::BoTx spent less time in the ROI and exhibited the orienting angles for a shorter duration than controls in the two large tank (control n = 20; cbln12::BoTx n = 24 in G, H) assays. Representative structures of time lag cross-correlation for 152B::BoTx and control fish (M) and cbln12::BoTx and control fish (O). Black bars indicate latency from time 0 to peak. Quantification of latency to peak correlation in 152B::BoTx and control fish (N) and cbln12::BoTx and control fish (P). Latency to peak correlation in cbln12::BoTx was significantly longer than that in control. See Extended Data Figure 2-1 for more details.

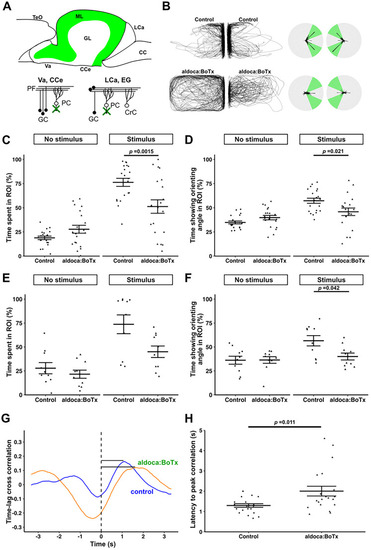
BoTx-mediated inhibition of PCs suppresses orienting behavior. Diagram for the expression pattern of BoTx in Tg(aldoca:BoTxBLC-GFP) (aldoca:BoTx) fish (A). aldoca::BoTx fish expresses BoTx in PCs. Orienting behavior of adult aldoca::BoTx fish. Sibling zebrafish that did not express BoTx were used as controls. BD, Orienting behavior in two large tanks. The same type of test fish was placed in both tanks. E, F, Orienting behavior toward wild-type control fish. A combination of large and small tanks was used. The test fish was placed in the large tank, while a wild-type fish was placed in the small tank (for visual stimulus). The orienting behavior of the test fish in the one tank (C, D; large tank for E, F) was analyzed. Percentages of the time spent in the ROI (C, E) and percentages of the time that fish showed the orienting angles in the ROI (D, F) are indicated. aldoca:BoTx spent less time in the ROI and exhibited the orienting angles for a shorter duration than controls in both the two large tank (n = 20 in C; n = 20 in D) and large/small tank (n = 10 in E; n = 10 in F) assays. Representative structures of time lag cross-correlation for aldoca:BoTx and control fish (G). Black bars indicate latency from time 0 to peak. Quantification of latency to peak correlation in aldoca:BoTx and control fish (H). Latency to peak correlation in aldoca:BoTx was significantly longer than that in control. See Extended Data Figure 3-1 for more details

reln mutants show defective orienting behavior. Orienting behavior of adult reln mutant homozygous fish (relnΔ7/Δ7) and control heterozygous fish (relnΔ7/+). AC, Orienting behavior in two large tanks. The same genotype of fish was placed in both tanks. D, E, Orienting behavior toward wild-type control fish. A combination of large and small tanks was used. The test fish was placed in the large tank, while a wild-type fish was placed in the small tank. Percentages of the time spent in the ROI (B, D) and percentages of the time that fish showed the orienting angle (C, E) are indicated. relnΔ7/Δ7 spent less time in the ROI and exhibited the orienting behavior for a shorter duration than controls in both the two large tank (n = 20 each in B, C) and large/small tank (n = 10 each in D, E) assays. Representative structures of time lag cross-correlation for relnΔ7/+ and relnΔ7/Δ7 fish (F). Black bars indicate latency from time 0 to peak. Quantification of latency to peak correlation in relnΔ7/Δ7 and relnΔ7/+fish (G). See Extended Data Figure 4-1 for more details.

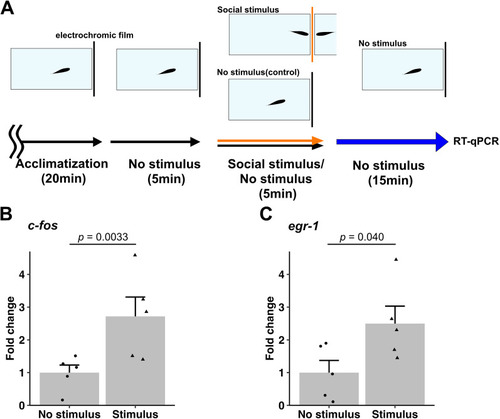
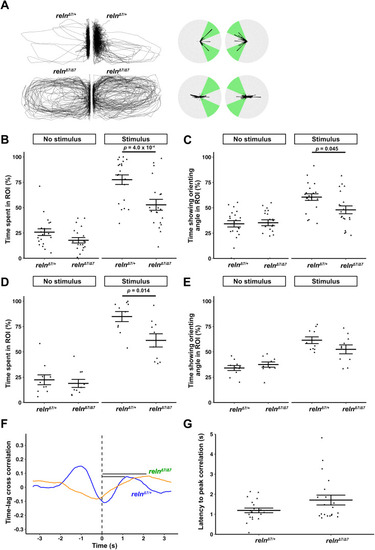
The cerebellum is activated during orienting behavior. A, Detection of neuronal activity during orienting behavior. After 20 min of acclimatization, zebrafish were allowed to swim for 5 min under no-stimulus condition, followed by 5 min of orienting behavior assays under no-stimulus or stimulus conditions. For RT-qPCR, zebrafish were further kept for 15 min under no-stimulus condition, and then RNA from the cerebellum was isolated. B, C, c-fos (B) and egr1 (C) expressions detected by RT-qPCR. c-fos and egr1 transcripts were amplified from cDNAs from the cerebellum of zebrafish under no-stimulus or stimulus conditions. Data are shown as ratios to expression in fish under no-stimulus conditions. Expressions of c-fos and egr1 mRNA significantly increased in the cerebellum of zebrafish that exhibited orienting behavior under stimulus conditions, compared with no-stimulus conditions (B, c-fos n = 5, C; egr1 n = 5). See Extended Data Figure 5-1 for more details.

Acknowledgments
This image is the copyrighted work of the attributed author or publisher, and ZFIN has permission only to display this image to its users. Additional permissions should be obtained from the applicable author or publisher of the image. Full text @ eNeuro