IMAGE

Figure 3.

ID
ZDB-IMAGE-241031-8
Source
Figures for Hosaka et al., 2024
Image
Figure Caption

Figure 3.

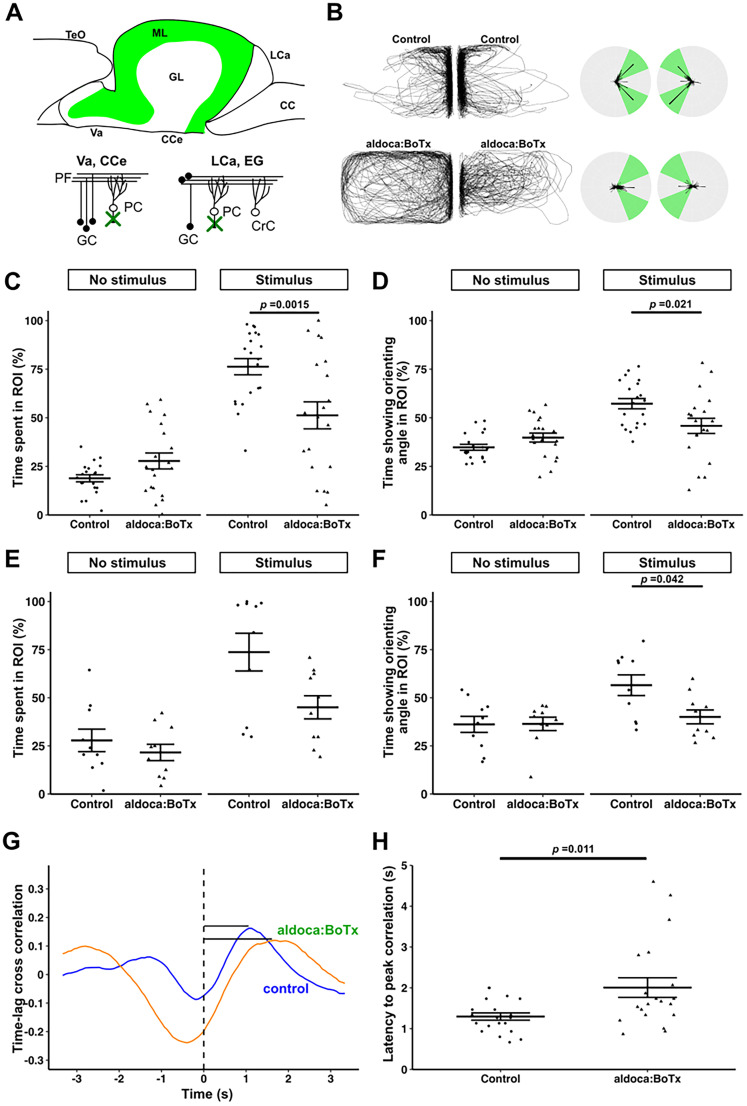
BoTx-mediated inhibition of PCs suppresses orienting behavior. Diagram for the expression pattern of BoTx in Tg(aldoca:BoTxBLC-GFP) (aldoca:BoTx) fish (A). aldoca::BoTx fish expresses BoTx in PCs. Orienting behavior of adult aldoca::BoTx fish. Sibling zebrafish that did not express BoTx were used as controls. BD, Orienting behavior in two large tanks. The same type of test fish was placed in both tanks. E, F, Orienting behavior toward wild-type control fish. A combination of large and small tanks was used. The test fish was placed in the large tank, while a wild-type fish was placed in the small tank (for visual stimulus). The orienting behavior of the test fish in the one tank (C, D; large tank for E, F) was analyzed. Percentages of the time spent in the ROI (C, E) and percentages of the time that fish showed the orienting angles in the ROI (D, F) are indicated. aldoca:BoTx spent less time in the ROI and exhibited the orienting angles for a shorter duration than controls in both the two large tank (n = 20 in C; n = 20 in D) and large/small tank (n = 10 in E; n = 10 in F) assays. Representative structures of time lag cross-correlation for aldoca:BoTx and control fish (G). Black bars indicate latency from time 0 to peak. Quantification of latency to peak correlation in aldoca:BoTx and control fish (H). Latency to peak correlation in aldoca:BoTx was significantly longer than that in control. See Extended Data Figure 3-1 for more details

Acknowledgments
This image is the copyrighted work of the attributed author or publisher, and ZFIN has permission only to display this image to its users. Additional permissions should be obtained from the applicable author or publisher of the image. Full text @ eNeuro