Construction of Eno2 mutant protein expression plasmid. A two-step PCR method was used to generate the expression plasmid, with the mutation of aspartic acid (D) to serine (S) at position 419 (Eno2-[D419S]) as an example. Four primers (p1 to p4) were used for the PCR, where p1 and p4 represent the forward and reverse flanking primers of the eno2 fragment, and p2 and p3 are complementary mutagenic primers carrying the mutation sequence. The plasmid pCS2-Eno2-wb- Flag containing the mouse eno2 gene fused with a Flag reporter gene and with wobble-modified nucleotides (wb) was used as the template in the first PCR step. Primers p1 and p2 were used to produce the upstream fragment of the gene containing the mutation site (X), while p3 and p4 were used to produce the downstream fragment. In the second PCR step, the products from the first step were mixed, and a small amount of p1 and p4 primers were added to generate the complete mutant gene fragment. After PCR completion, the mutant gene fragment and the pCS2 plasmid were digested with EcoRI and XhoI restriction enzymes to produce sticky-ended inserts and vectors. Finally, the insert and vector were ligated to create the pCS2-derived expression plasmid for the Eno2 mutant protein fused with the Flag reporter gene. Blue color: eno2 cDNA; orange color: reporter Flag; red color: mutation site; grey color: plasmid pCS2+ backbone.

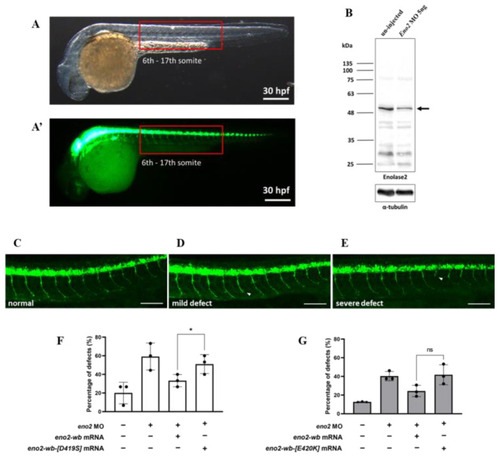
Western blot analysis demonstrated that the recombinant Eno2-wb protein was expressed in the Eno2-knockdown cells transfected with siRNA. NSC34 cells were transfected with eno2 siRNA to knock down the endogenous Eno2, followed by transfection DNA encoding Eno2 but consisting of nucleotides modified at the wobble position (Eno2-wb) to avoid the block by introducing siRNA. The expression level of Eno2 protein in the cells was detected by the Eno2 antibody. Lane 1 was the control group, and its Eno2 expressional level was set at 1, while lanes 2–4 represented Eno2 expressed within NSC cells treated without (−) or with (+) eno2 siRNA or eno2-wb. The expressional level of Eno2 was quantified relative to that of α-Tubulin that served as an internal control. The number listed below each lane indicates the fold change of Eno2 intensity of each treatment compared to the control group, set as 1.

The effect of various point mutations in Eno2 on promoting the neurite growth of motor neurons. (A,B) Morphological differentiation of cultured NSC34 neural cells: (A) one-day incubation; (B) five-day incubation. Axonal neurites derived from cultured NSC34 cells were observed, and the neurite length was measured. (C) Statistical analysis of the average length of neurites. NSC34 cells transfected with siRNA (pCS2+) to inhibit endogenous mouse eno2 served as a negative control. After transfection with eno2 siRNA, eno2 DNA with modified wobble-nucleotides (eno2-wb) was transfected in NSC34. The resultant neurite length was normalized to a value of 1.0, which served as the positive control. The average neurite length of motor neurons was measured after transfection with siRNA, followed by transfection with plasmid harboring different point-mutated eno2-wb DNA. The fold change in neurite length was calculated relative to the positive control set as 1.0. Then, each experimental group was independently compared with the control group using t-test for statistical analysis (* p < 0.05, ** p < 0.01; ns indicates no significant difference). The t values and degrees of freedom for groups of -[L410I], -[M411L], -[D419S], -[E420K], -[R422K], -[H426R] and -[N427S] were 0.5754 and 2, 2.309 and 2, 6.362 and 3, 2.064 and 3, 5.413 and 2, 4.255 and 2, and 4.496 and 3, respectively.

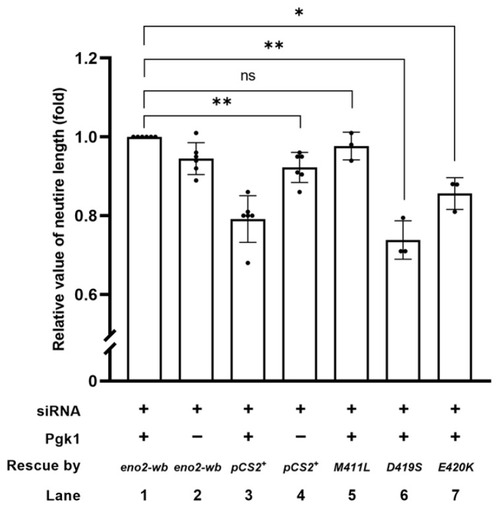
The synergistic effect of promoting motor neurons by the addition of Pgk1 and transfection of various mutations of Eno2. Statistical analysis of the average length of neurites. NSC34 neural cells transfected with siRNA (pCS2+) to inhibit endogenous mouse Eno2 without the addition of extracellular Pgk1 (ePgk1) served as a negative control. As the positive control, NSC34 cells were transfected with eno2 siRNA, followed by transfection of wobble-modified eno2 DNA (eno2-wb) combined with Pgk1 immersion. The resultant average neurite length was normalized as 1.0. Similarly, plasmid harboring a point-mutated eno2 DNA, as indicated, was transfected in siRNA-treated cells, followed by Pgk1 immersion. The average neurite length of motor neurons was measured, and fold change compared to the positive control was calculated. Each experimental group was independently compared with the control group using Student’s t-test for statistical significance (* p < 0.05; ** p < 0.01; ns indicates no significant difference). The t values and degrees of freedom for groups of pCS2+, -[M411L], -[D419S] and –[E420K] were 4.972 and 5, 1.151 and 2, 9.281 and 2, and 6.189 and 2, respectively.

The rescue effect of mutant eno2 mRNA on Eno2 knockdown in zebrafish embryos. Microinjection was performed at the one-cell stage in the transgenic line Tg(mnx1:GFP). Embryos were collected at 30 hpf and observed for motor neurons in the 6th to 17th somites, as shown in Figure (A,A’) with (A) under visible light and (A’) under fluorescence. (B) Western blot analysis comparing Eno2 protein levels (indicated by arrows) in embryos with and without MO injection, using rabbit anti−Eno2 antibodies for detection. (CE) Three phenotypes: normal, mild defect, and severe defect with arrows indicating defect locations. Scale bar: 100 μm. (F,G) Frequency of defects. Control groups were designated as (1) the control group without treatment; (2) the eno2 MO group in which injection with eno2-specific antisense morpholino oligonucleotide (MO) served as a negative control; and (3) the MO plus eno2 mRNA group in which co-injection of eno2 MO and eno2-wb mRNA served as a positive control. Experimental groups were (F) the MO plus eno2-wb-[D419S] mRNA group: co-injection of eno2 MO combined with eno2-wb-[D419S] mRNA; and (G) the MO plus eno2[E420K] mRNA group: co-injection of eno2 MO combined with eno2-wb-[E420K] mRNA. Both figures represent the averages of three independent experiments. White indicates the percentage of severe defects, gray indicates the percentage of mild defects, and black indicates the overall defect percentage. Statistical significance was analyzed using one-way ANOVA (* indicates p < 0.05; ns indicates no significant difference). F statistics of (F) were 1.401 as numerator and 2.802 as denominator, while (G) were 1.917 as numerator and 3.833 as denominator.

The effect of overexpressing mutant Eno2 on the occurrence rate of branched axons of motor neurons in zebrafish embryos immersed with recombinant Pgk1. (A,B) Two phenotypes of the caudal primary (CaP) axons of motor neurons in the 30 hpf transgenic line Tg(mnx1:GFP) embryos. (A) Examples of normal phenotype and (B) branched axon phenotype (branching sites indicated by white arrowheads). Scale bar: 50 μm. Experimental manipulations were performed at the one-cell stage. The first group of zebrafish embryos served as the non-injected control group, the second group was injected with mouse eno2-wb mRNA, and the third group was injected with mutated eno2-wb mRNA. At 30 hpf, the percentage of embryos exhibiting the branched axonal phenotype among CaP neurons was calculated for each group. (C) The results of embryos injected with eno2-wb-[D419] mRNA and (D) the results of embryos injected with eno2-wb-[E420K] mRNA. Each panel represents the average of three independent experiments with statistical analysis performed using one-way ANOVA (*, p < 0.05; ns indicates no significant difference). F statistics of (C) were 1.239 as numerator and 2.478 as denominator, while (D) were 1 as numerator and 2.001 as denominator.

Using Western blot to analyze the level of phosphorylated Cofilin (p-Cofilin) expressed in NSC34 cells. (A) Western blot analysis. NSC34 cells were transfected with eno2-siRNA to knock down endogenous Eno2, then rescued with different DNA material, as indicated, in the absence (−) or presence (+) of Pgk1 protein. pCS+: plasmid with an siRNA insertion; eno2-wb: wild type Eno2 but consisting of nucleotides modified at wobble position (eno2-wb) to avoid being blocked by introducing siRNA; and D419S: mutant Eno2-wb consisting of an aspartic acid mutated into serine at the 419th position of Eno2. The expressional level of p-Cofilin at Ser3 was quantified relative to that of α-Tubulin, which served as an internal control. The number listed below each lane indicates the fold change of the p-Cofilin intensity of each treatment compared to the control group, set as 1. (B) Quantitative and statistical analyses. Data were averaged from three independent experiments and presented as mean ± SD (n = 3). One-way ANOVA, followed by Tukey’s multiple comparison test, was used to perform statistical analysis (** p < 0.005). F statistics were 4 as numerator and 10 as denominator.

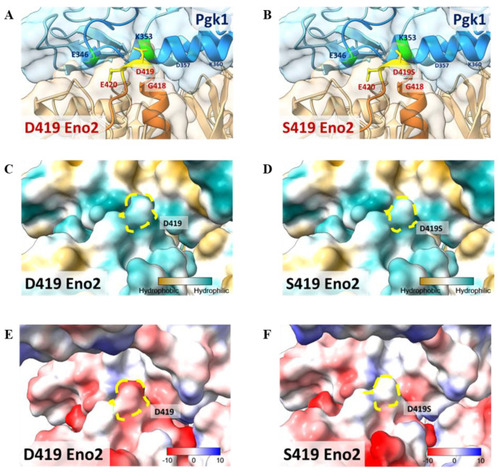
Molecular docking model to illustrate the key amino acid involved in Eno2-ePgk1 interaction. (A,B) Simulated model to illustrate how Eno2 (PDB ID: 5TD9) interacted with ePgk1 (PDB ID: 2ZGV) is presented in blue and orange, respectively. Drawing of partial enlargement of critical amino acid residues involved in Eno2-ePgk1 interaction was presented, including (A) wild-type Eno2 D419 and (B) mutant Eno2 D419S. The segment of the 345th to 360th amino acids of Pgk1, the segment of the 404th to 431st amino acid of Eno2, and the mutant Eno2 D419th were shown in Dodger blue, chocolate, and orange, respectively. (C,D) Drawing of partial enlargement of the surface polarity distribution of (C) Eno2 D419 and (D) Eno2 D419S. Dotted circles highlighted the D419th residue on Eno2. Lipophilicity was presented as low (hydrophilicity, in cyan) to high (hydrophobicity, in brown). Dotted zone indicates the 419th site. (E,F) Drawing of partial enlargement of the surface charge distribution of (E) Eno2 D419 and (F) Eno2 D419S. Chargeability from negative charge (in red) to positive charge (in blue). Dotted circles marked the 419th residue of Eno2.

Acknowledgments
This image is the copyrighted work of the attributed author or publisher, and ZFIN has permission only to display this image to its users. Additional permissions should be obtained from the applicable author or publisher of the image. Full text @ Int. J. Mol. Sci.