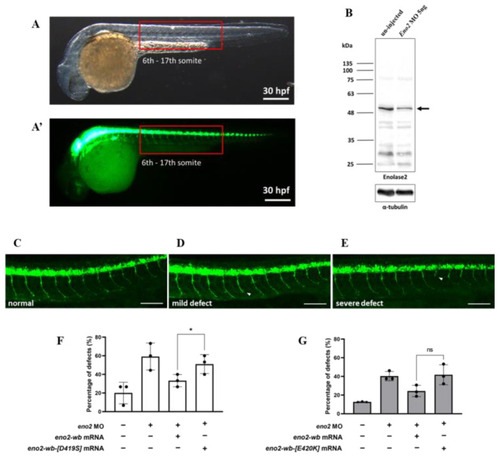
The rescue effect of mutant eno2 mRNA on Eno2 knockdown in zebrafish embryos. Microinjection was performed at the one-cell stage in the transgenic line Tg(mnx1:GFP). Embryos were collected at 30 hpf and observed for motor neurons in the 6th to 17th somites, as shown in Figure (A,A’) with (A) under visible light and (A’) under fluorescence. (B) Western blot analysis comparing Eno2 protein levels (indicated by arrows) in embryos with and without MO injection, using rabbit anti−Eno2 antibodies for detection. (C–E) Three phenotypes: normal, mild defect, and severe defect with arrows indicating defect locations. Scale bar: 100 μm. (F,G) Frequency of defects. Control groups were designated as (1) the control group without treatment; (2) the eno2 MO group in which injection with eno2-specific antisense morpholino oligonucleotide (MO) served as a negative control; and (3) the MO plus eno2 mRNA group in which co-injection of eno2 MO and eno2-wb mRNA served as a positive control. Experimental groups were (F) the MO plus eno2-wb-[D419S] mRNA group: co-injection of eno2 MO combined with eno2-wb-[D419S] mRNA; and (G) the MO plus eno2[E420K] mRNA group: co-injection of eno2 MO combined with eno2-wb-[E420K] mRNA. Both figures represent the averages of three independent experiments. White indicates the percentage of severe defects, gray indicates the percentage of mild defects, and black indicates the overall defect percentage. Statistical significance was analyzed using one-way ANOVA (* indicates p < 0.05; ns indicates no significant difference). F statistics of (F) were 1.401 as numerator and 2.802 as denominator, while (G) were 1.917 as numerator and 3.833 as denominator.
|
