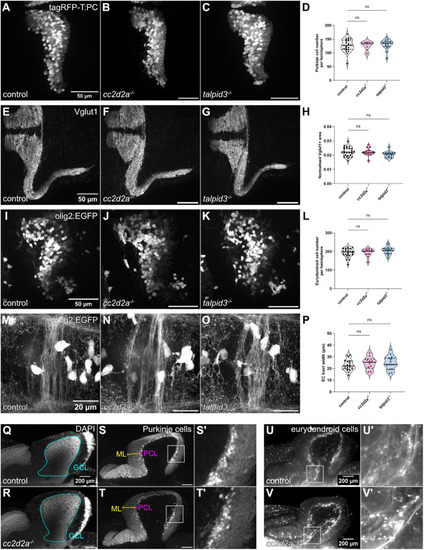
Morphological development of the cerebellum is unaffected in cc2d2a and talpid3 mutants. (A-C) Whole-mount maximum projection confocal images showing tagRFP-T-positive Purkinje cells in control (A), cc2d2a−/− (B) and talpid3−/− (C) Tg(tagRFP-T:PC:GCaMP5G) larvae at 5 dpf. Note the similar morphology of the PCL in mutants and controls. (D) Violin plot showing no statistically significant difference in the number of tagRFP-T-positive Purkinje cells per cerebellar hemisphere in mutants compared to controls. Control n=24 larvae (N=4), cc2d2a−/− n=5 larvae (N=2, P=0.99), talpid3−/− n=16 larvae (N=2, P=0.82). (E-G) Whole-mount maximum projection confocal immunofluorescence images showing normal morphology of Vglut1-positive parallel fibres in control (E), cc2d2a−/− (F) and talpid3−/− (G) larvae at 5 dpf. (H) Violin plot showing no statistically significant difference in the normalised Vglut1-positive fluorescence area in mutants compared to controls. Control n=27 larvae (N=4), cc2d2a−/− n=15 larvae (N=2, P=1.00), talpid3−/− n=12 larvae (N=2, P=0.21). (I-K) Whole-mount maximum projection confocal images showing EGFP-positive eurydendroid cells in control (I), cc2d2a−/− (J) and talpid3−/− (K) Tg(olig2:EGFP) larvae at 5 dpf. The morphology of the eurydendroid cell layer is similar in mutants and controls. (L) Violin plot showing no statistically significant difference in the number of EGFP-positive eurydendroid cells per cerebellar hemisphere in mutants compared to controls. Control n=25 larvae (N=4), cc2d2a−/− n=11 larvae (N=2, P=0.99), talpid3−/− n=16 larvae (N=2, P=0.20). (M–O) Whole-mount maximum projection confocal images showing EGFP-positive eurydendroid cell axons in control (M), cc2d2a−/− (N) and talpid3−/− (O) Tg(olig2:EGFP) larvae at 5 dpf. (P) Violin plot showing quantification of the EGFP-positive axon tract thickness, where no statistically significant difference is observed in mutants compared to controls. Control n=19 larvae (N=4), cc2d2a−/− n=10 larvae (N=2, P=0.65), talpid3−/− n=15 larvae (N=2, P=0.50). For violin plots in D, H, L and P, each data point represents one larva. Violin plots represent median (thick line) and quartiles (dashed line). ns, not significant. Ordinary one-way ANOVA with post-hoc Dunnett's multiple comparisons test. For A-O, images show a dorsal view of 5 dpf larvae with anterior to the left. For A-K, image scale bars are 50 µm and for M-O, image scale bars are 20 µm. N denotes the number of independent experiments (i.e. larvae from independent clutches) used for analysis. Analyses were carried out using mz cc2d2a−/− and zygotic talpid3−/− mutants. (Q-T) Representative maximum projection mesoSPIM images showing an optical sagittal section of DAPI-stained nuclei and tagRFP-T-positive Purkinje cells in the cerebellum of Tg(tagRFP-T:PC:GCaMP5G) 11-12 wpf control (Q, n=4, N=2; S, n=10, N=4) and zygotic cc2d2a−/− (R, n=4, N=2; T, n=6, N=3) fish. (S’,T’) Higher magnification images of boxed regions in S and T, respectively. The GCL is outlined with a cyan line, the PCL is indicated with a magenta bracket and the ML with a yellow bracket. The morphology of all layers is unchanged in mutants. (U,V) Maximum projection mesoSPIM images showing an optical sagittal section of olig2:EGFP-positive eurydendroid cells in the cerebellum of Tg(olig2:EGFP) 11-12 wpf control (U, n=3, N=2) and zygotic cc2d2a−/− (V, n=3, N=2) fish. Eurydendroid cells and axons appear normal in mutants compared to controls. U’ and V’ show higher magnification images of boxed regions in U and V, respectively. For Q-V, images show a sagittal view with anterior to the left; scale bars: 200 µm. N denotes the number of independent experiments (i.e. larvae from independent clutches) used for analysis.
|

