Figure Caption
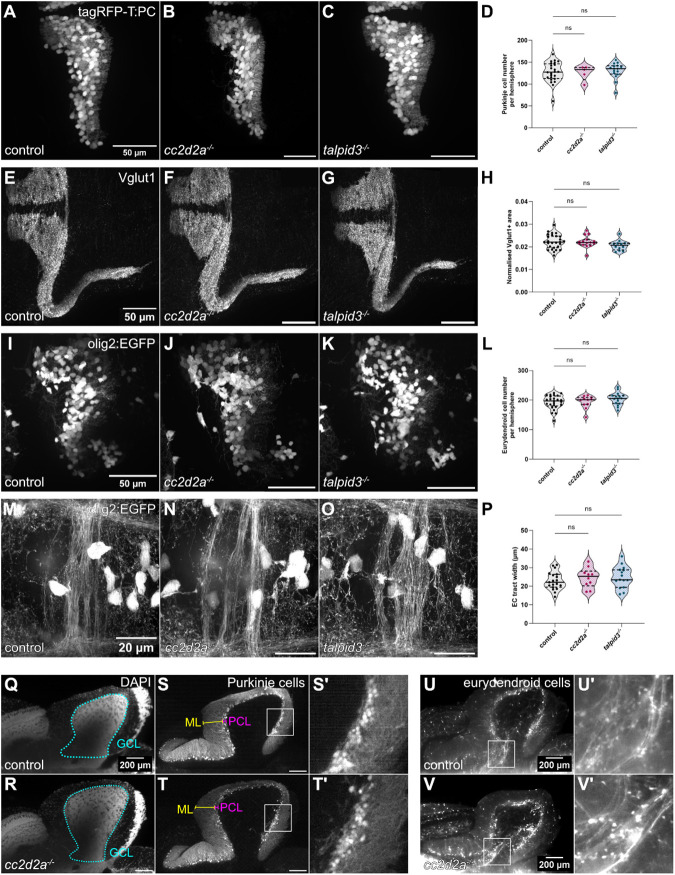
Fig. 4.
Morphological development of the cerebellum is unaffected in cc2d2a and talpid3 mutants. (A-C) Whole-mount maximum projection confocal images showing tagRFP-T-positive Purkinje cells in control (A), cc2d2a−/− (B) and talpid3−/− (C) Tg(tagRFP-T:PC:GCaMP5G) larvae at 5 dpf. Note the similar morphology of the PCL in mutants and controls. (D) Violin plot showing no statistically significant difference in the number of tagRFP-T-positive Purkinje cells per cerebellar hemisphere in mutants compared to controls. Control n=24 larvae (N=4), cc2d2a−/− n=5 larvae (N=2, P=0.99), talpid3−/− n=16 larvae (N=2, P=0.82). (E-G) Whole-mount maximum projection confocal immunofluorescence images showing normal morphology of Vglut1-positive parallel fibres in control (E), cc2d2a−/− (F) and talpid3−/− (G) larvae at 5 dpf. (H) Violin plot showing no statistically significant difference in the normalised Vglut1-positive fluorescence area in mutants compared to controls. Control n=27 larvae (N=4), cc2d2a−/− n=15 larvae (N=2, P=1.00), talpid3−/− n=12 larvae (N=2, P=0.21). (I-K) Whole-mount maximum projection confocal images showing EGFP-positive eurydendroid cells in control (I), cc2d2a−/− (J) and talpid3−/− (K) Tg(olig2:EGFP) larvae at 5 dpf. The morphology of the eurydendroid cell layer is similar in mutants and controls. (L) Violin plot showing no statistically significant difference in the number of EGFP-positive eurydendroid cells per cerebellar hemisphere in mutants compared to controls. Control n=25 larvae (N=4), cc2d2a−/− n=11 larvae (N=2, P=0.99), talpid3−/− n=16 larvae (N=2, P=0.20). (M–O) Whole-mount maximum projection confocal images showing EGFP-positive eurydendroid cell axons in control (M), cc2d2a−/− (N) and talpid3−/− (O) Tg(olig2:EGFP) larvae at 5 dpf. (P) Violin plot showing quantification of the EGFP-positive axon tract thickness, where no statistically significant difference is observed in mutants compared to controls. Control n=19 larvae (N=4), cc2d2a−/− n=10 larvae (N=2, P=0.65), talpid3−/− n=15 larvae (N=2, P=0.50). For violin plots in D, H, L and P, each data point represents one larva. Violin plots represent median (thick line) and quartiles (dashed line). ns, not significant. Ordinary one-way ANOVA with post-hoc Dunnett's multiple comparisons test. For A-O, images show a dorsal view of 5 dpf larvae with anterior to the left. For A-K, image scale bars are 50 µm and for M-O, image scale bars are 20 µm. N denotes the number of independent experiments (i.e. larvae from independent clutches) used for analysis. Analyses were carried out using mz cc2d2a−/− and zygotic talpid3−/− mutants. (Q-T) Representative maximum projection mesoSPIM images showing an optical sagittal section of DAPI-stained nuclei and tagRFP-T-positive Purkinje cells in the cerebellum of Tg(tagRFP-T:PC:GCaMP5G) 11-12 wpf control (Q, n=4, N=2; S, n=10, N=4) and zygotic cc2d2a−/− (R, n=4, N=2; T, n=6, N=3) fish. (S’,T’) Higher magnification images of boxed regions in S and T, respectively. The GCL is outlined with a cyan line, the PCL is indicated with a magenta bracket and the ML with a yellow bracket. The morphology of all layers is unchanged in mutants. (U,V) Maximum projection mesoSPIM images showing an optical sagittal section of olig2:EGFP-positive eurydendroid cells in the cerebellum of Tg(olig2:EGFP) 11-12 wpf control (U, n=3, N=2) and zygotic cc2d2a−/− (V, n=3, N=2) fish. Eurydendroid cells and axons appear normal in mutants compared to controls. U’ and V’ show higher magnification images of boxed regions in U and V, respectively. For Q-V, images show a sagittal view with anterior to the left; scale bars: 200 µm. N denotes the number of independent experiments (i.e. larvae from independent clutches) used for analysis.
Acknowledgments
This image is the copyrighted work of the attributed author or publisher, and
ZFIN has permission only to display this image to its users.
Additional permissions should be obtained from the applicable author or publisher of the image.
Full text @ Biol. Open