
- Title
-
Multi-faceted potential of sophoridine compound's anti-arrhythmic and antioxidant effects through ROS/CaMKII pathway
- Authors
- Sun, S., Shi, F., Zhao, G., Zhang, H.
- Source
- Full text @ Heliyon
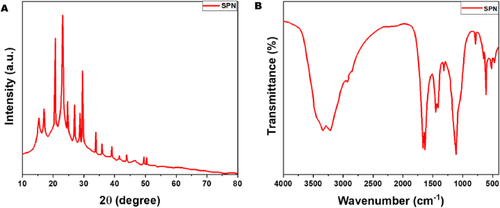
XRD pattern analysis of SPN (A) and FTIR spectrum of SPN (B). |
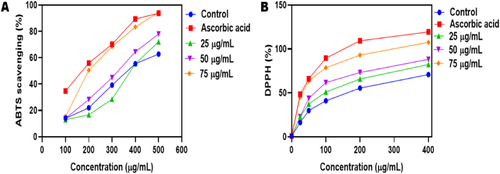
Antioxidant activity of SPN at 25, 50 and 75 μg/mL concentrations measured using ABTS (A) and DPPH scavenging assays for 45 min of incubation (B). |
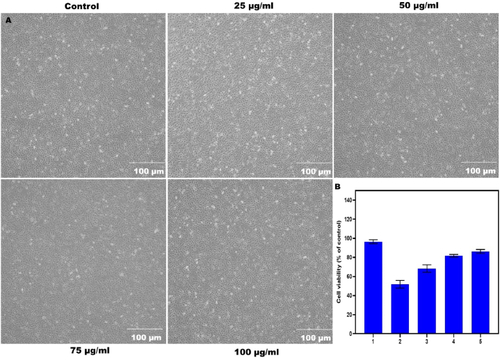
Phase contrast microscopic images on H9c2 cell viability of SPN concentrations at 25, 50, 75 and 100 μg/ml at 24 h of incubation (A); Cell viability % compared to control with statistical significance (B). |
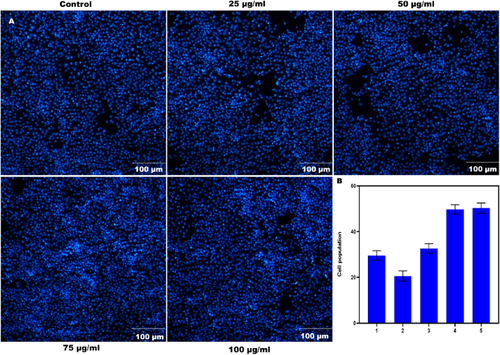
DAPI images demonstrate the nuclear structure of SPN-treated H9c2 cells at varying concentrations at 10 min. The trials were conducted three times (A). The cell population is displayed as a percentage, indicating its importance (B). |
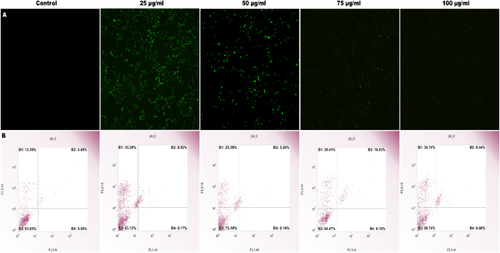
H9c2 cell lines were subjected to oxidative stress by exposure to various concentrations of SPN. Fluorescent microscope pictures were taken at 100 μm, 10× magnification (A). The percentage of apoptotic H9c2 cells was determined at different SPN doses by annexin V/PI staining (B). |
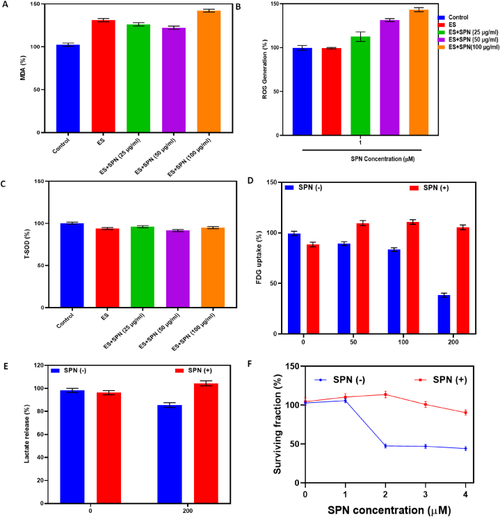
Measurement of malondialdehyde (MDA), reactive oxygen species (ROS), and total superoxide dismutase (T-SOD) in zebrafish following treatment with SPN and electrical stimulation. Values are expressed as mean ± SD. ∗p < 0.05 and ∗∗p < 0.01 vs. control (A,B and C). FDG uptake and lactate release in differentiated H9C2 cells after 24-h exposure to 200 μM SPN (D&E) Time course of reduced survival over 72-h exposure to graded doses of SPN. Data are the mean ± SE of values obtained from independent experiments. p < 0.005; ‡p < 0.001 compared with untreated controls (F). |
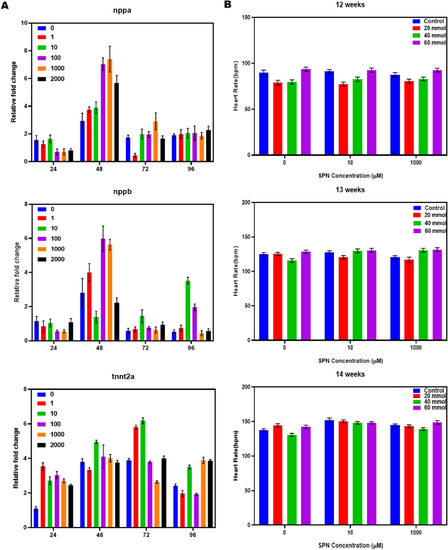
Quantification of cardiovascular gene expression levels (nppa, nppb, and tnnt2a) following treatment with SPN for 24, 48, 72, and 96 h, and subsequent normalization of the values. Gene expression is displayed as fold induction relative to controls at each time point. (A). Heart rate of zebrafish at 12, 13 and 14 weeks by SPN treatment. One-way ANOVA was used in analysis and data was expressed as mean ± SD from three independent biological replicates of at each. ∗p < 0.05, ∗∗p < 0.01, and ∗∗∗p < 0.001 compared to control groups (B). |
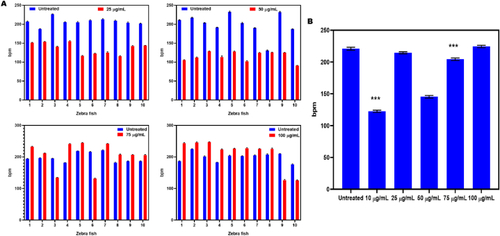
Identifying changes in heart rate in zebrafish following treatment with SPN that either decrease or enhance heart contraction rate. The heart rate of 10 zebrafish was monitored right before administering the medication (A). Note that the same response to drug administration was observed in all zebrafish Statistical analysis of zebrafish indicates that SPN regulates cardiac rate after expressing electrical stimulation (B). The experiments were expressed as mean ± SD. Three independent biological replicates were included. ∗p < 0.05, compared among groups. |
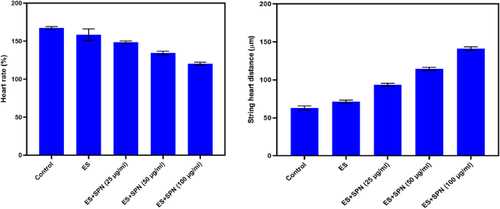
Impact of SPN exposure on zebrafish cardiac abnormalities, heart rate variability based on 100 μg/ml concentration, and string heart distance. ∗∗∗p < 0.0001 versus control. |