
FIGURE
Fig. 7
Fig. 7
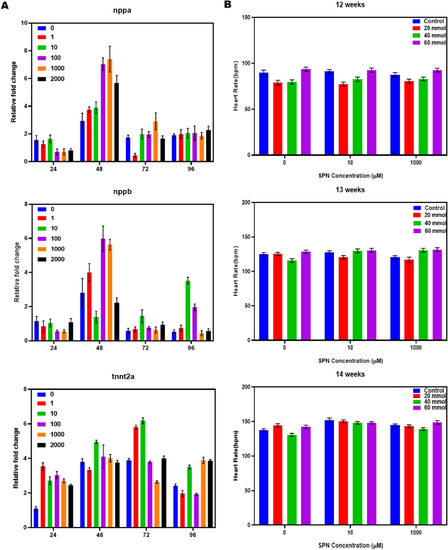
Quantification of cardiovascular gene expression levels (nppa, nppb, and tnnt2a) following treatment with SPN for 24, 48, 72, and 96 h, and subsequent normalization of the values. Gene expression is displayed as fold induction relative to controls at each time point. (A). Heart rate of zebrafish at 12, 13 and 14 weeks by SPN treatment. One-way ANOVA was used in analysis and data was expressed as mean ± SD from three independent biological replicates of at each. ∗p < 0.05, ∗∗p < 0.01, and ∗∗∗p < 0.001 compared to control groups (B). |
Expression Data
Expression Detail
Antibody Labeling
Phenotype Data
Phenotype Detail
Acknowledgments
This image is the copyrighted work of the attributed author or publisher, and
ZFIN has permission only to display this image to its users.
Additional permissions should be obtained from the applicable author or publisher of the image.
Full text @ Heliyon