
FIGURE
Fig. 5
Fig. 5
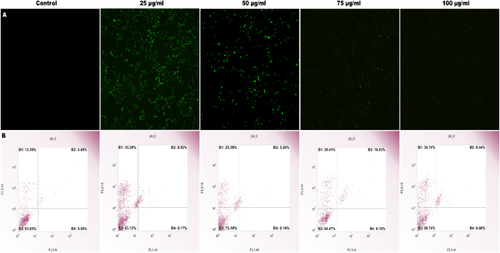
H9c2 cell lines were subjected to oxidative stress by exposure to various concentrations of SPN. Fluorescent microscope pictures were taken at 100 μm, 10× magnification (A). The percentage of apoptotic H9c2 cells was determined at different SPN doses by annexin V/PI staining (B). |
Expression Data
Expression Detail
Antibody Labeling
Phenotype Data
Phenotype Detail
Acknowledgments
This image is the copyrighted work of the attributed author or publisher, and
ZFIN has permission only to display this image to its users.
Additional permissions should be obtained from the applicable author or publisher of the image.
Full text @ Heliyon