
FIGURE
Fig. 4
Fig. 4
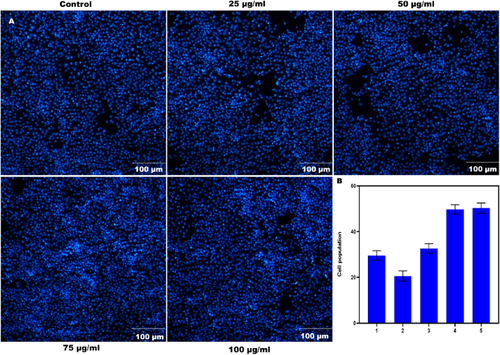
DAPI images demonstrate the nuclear structure of SPN-treated H9c2 cells at varying concentrations at 10 min. The trials were conducted three times (A). The cell population is displayed as a percentage, indicating its importance (B). |
Expression Data
Expression Detail
Antibody Labeling
Phenotype Data
Phenotype Detail
Acknowledgments
This image is the copyrighted work of the attributed author or publisher, and
ZFIN has permission only to display this image to its users.
Additional permissions should be obtained from the applicable author or publisher of the image.
Full text @ Heliyon