
- Title
-
Regulatory elements in SEM1-DLX5-DLX6 (7q21.3) locus contribute to genetic control of coronal nonsyndromic craniosynostosis and bone density-related traits
- Authors
- Nicoletti, P., Zafer, S., Matok, L., Irron, I., Patrick, M., Haklai, R., Evangelista, J.E., Marino, G.B., Ma'ayan, A., Sewda, A., Holmes, G., Britton, S.R., Lee, W.J., Wu, M., Ru, Y., Arnaud, E., Botto, L., Brody, L.C., Byren, J.C., Caggana, M., Carmichael, S.L., Cilliers, D., Conway, K., Crawford, K., Cuellar, A., Di Rocco, F., Engel, M., Fearon, J., Feldkamp, M.L., Finnell, R., Fisher, S., Freudlsperger, C., Garcia-Fructuoso, G., Hagge, R., Heuzé, Y., Harshbarger, R.J., Hobbs, C., Howley, M., Jenkins, M.M., Johnson, D., Justice, C.M., Kane, A., Kay, D., Gosain, A.K., Langlois, P., Legal-Mallet, L., Lin, A.E., Mills, J.L., Morton, J.E.V., Noons, P., Olshan, A., Persing, J., Phipps, J.M., Redett, R., Reefhuis, J., Rizk, E., Samson, T.D., Shaw, G.M., Sicko, R., Smith, N., Staffenberg, D., Stoler, J., Sweeney, E., Taub, P.J., Timberlake, A.T., Topczewska, J., Wall, S.A., Wilson, A.F., Wilson, L.C., Boyadjiev, S.A., Wilkie, A.O.M., Richtsmeier, J.T., Jabs, E.W., Romitti, P.A., Karasik, D., Birnbaum, R.Y., Peter, I.
- Source
- Full text @ Genet Med Open
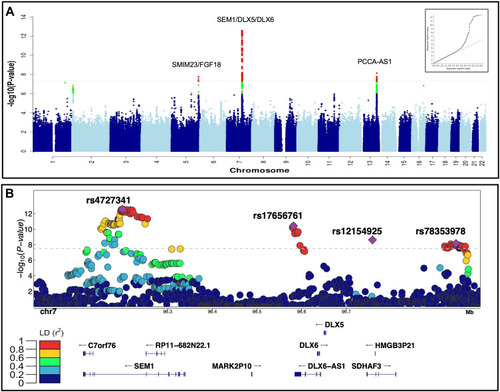
Summary of the genome-wide analysis of coronal nonsyndromic craniosynostosis. A. Manhattan plot of the meta-analysis of discovery and replication genome-wide association analyses using common variants (minor allele frequency > 1%). The y-axis shows the −log10 transformed P value of each variant association found using a standard-error-weighted approach and controlling for population stratification, and the x-axis shows the chromosomal position. Variants crossing the genome-wide significance threshold of P < 5E−08 are color coded in red, and those with P < 5E−06 are in green. The top signals are annotated with the closest genes. Inset: quantile-quantile plot showing distribution of expected P values under the null model (red-dotted line) vs observed P values (black dots). B. Regional plot of the 4 top independent genomic association signals from the European meta-analyses. The y-axis shows −log10 P values for individual variants annotated with the genes in the selected genomic interval. The top variants are marked as purple diamonds and other variants in pairwise linkage disequilibrium (r2) with the top variant, based on the 1000 Genomes Project Phase 3 European reference samples, are color coded as per the scale in legend. |
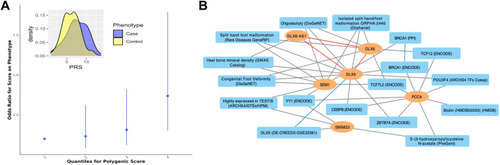
Multilocus analysis of the top susceptibility loci. A. Polygenic risk score calculated using genome-wide association study summary statistics from our discovery cohort was used to predict the risk for coronal nonsyndromic craniosynostosis in the replication cohort. Best fit model was achieved by PRsice with 106 variants with association P < 5E−05. Inset: difference in means of Polygenic risk score values in the craniosynostosis cases (blue) and the control group (yellow) are shown. B. Knowledge graph connecting the identified genes with shared enriched functional terms from Enrichr. In the network, identified genes are represented as orange ovals, whereas shared enriched annotations from Enrichr are shown as blue rectangles. Known physical interactions between the protein products of the identified genes are depicted by red lines, connections to functional terms are depicted by gray lines, and related terms are connected by blue lines. |
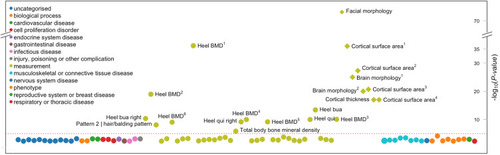
Phenome-wide association analysis of rs4727341, the top risk variant. Phenotype-wide association analysis of complex traits associated with rs4727341. Summary statistics from the UK Biobank, FinnGen, and genome-wide association study catalog repositories were downloaded from Open Target (https://genetics.opentargets.org/). Only traits with P value < .005 are shown in the diagram. x axis shows traits and y axis shows the variant’s P value of association to each trait. The circles are color coded by the trait category (see legend) as reported in Open Target website. The red dashed line shows the significance threshold corrected for the number of traits shown. In the figure, heel bone mineral density and other traits appear multiple times since the association was reported in many independent studies/publications as follows: heel bone mineral density (Heel BMD): 1GCST006979, 2GCST006288, 3NEALE2_3148_raw, 4NEALE2_78_raw (t score automated), 5NEALE2_4125_raw (t score automated right), 6NEALE2_4124_raw (right); cortical surface area: 1GCST010282_20: pars triangularis, 2GCST010701: MOSTest, 3GCST010697: min P and 4GCST90091060; other heel measurements are also shown—heel broadband ultrasound attenuation (heel bua): NEALE2_3144_raw: direct entry and NEALE2_4120_raw: right); and heel quantitative ultrasound index (heel qui): NEALE2_3147_raw: direct entry and NEALE2_4123_raw: right. |
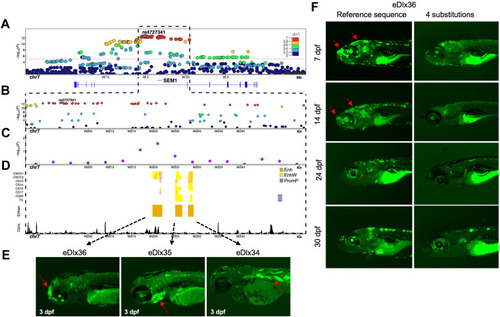
Enhancer analysis of the SEM1 locus. A. A regional association plot surrounding the top risk variant, rs4727341 (shown as a purple diamond). The x axis represents a 0.2 Mb region, 100 kb upstream and downstream of the lead variant; the y axis shows −log10 P values for individual variant associations from the European meta-analysis annotated with the genes in the selected genomic interval. Pairwise linkage disequilibrium (LD) (r2) with the lead variant color coded based on the 1000 Genomes Project Phase 3 European reference samples. B. Zoom-in of the top signal region to highlight the rs4727341-LD region (r2 > 0.9) (dashed black box). The y axis shows −log10 P values for individual variant associations from the European meta-analysis as above. Pairwise LD (r2) with the lead variant color coded based on the 1000 Genomes Project Phase 3 European reference samples. C. Zoom-in genomic region annotated with −log10 P values for individual 6 kb sliding windows from rare variant TDT aggregate analysis of rare variants in family-based study (purple dots). The dot is represented at the start of each window. D. Predicted craniofacial regulatory elements near rs4727341. Histone modification marks are associated with active craniofacial predicted enhancers (CNCC1 through F2).13 Highlighted are 3 predicted enhancer candidates (Enhan.), eDlx34, eDlx35, and eDlx36, which were tested in this study (orange bar). Phylop conservation track (Cons.) from University of California Santa Cruz (UCSC) Genome Browser is shown in black color. E. Zebrafish enhancer assays at 3 days after fertilization (dpf). eDlx34 drove green fluorescent protein (GFP) expression in the heart and somitic muscles. eDlx35 drove specific GFP expression in the mandibular arch and branchial arches (basibranchials, hypobranchials, and ceratobranchial 1-5) and notochord. eDlx36 drove specific GFP expression in the premaxillary, maxillary, FNP, and apical region of the skull. F. The effect of 4 rare variants on the in vivo eDlx36 enhancer activity. GFP-positive cells drove by eDlx36 enhancer in the FNP and apical region of the skull at 7 and 14 dpf, whereas the mutated eDlx36 embryos showed low GFP expression and fewer GFP-positive embryos in the craniofacial tissues at 7,14, 24, and 30 dpf. |