
|
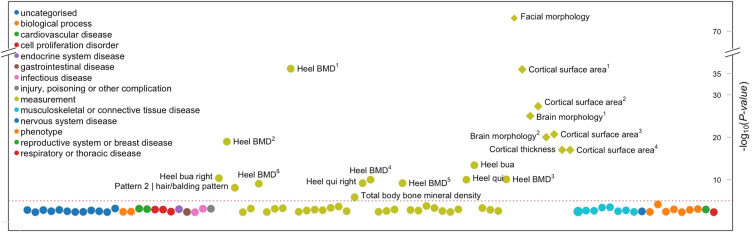
Fig. 3 Phenome-wide association analysis of rs4727341, the top risk variant. Phenotype-wide association analysis of complex traits associated with rs4727341. Summary statistics from the UK Biobank, FinnGen, and genome-wide association study catalog repositories were downloaded from Open Target (https://genetics.opentargets.org/). Only traits with P value < .005 are shown in the diagram. x axis shows traits and y axis shows the variant’s P value of association to each trait. The circles are color coded by the trait category (see legend) as reported in Open Target website. The red dashed line shows the significance threshold corrected for the number of traits shown. In the figure, heel bone mineral density and other traits appear multiple times since the association was reported in many independent studies/publications as follows: heel bone mineral density (Heel BMD): 1GCST006979, 2GCST006288, 3NEALE2_3148_raw, 4NEALE2_78_raw (t score automated), 5NEALE2_4125_raw (t score automated right), 6NEALE2_4124_raw (right); cortical surface area: 1GCST010282_20: pars triangularis, 2GCST010701: MOSTest, 3GCST010697: min P and 4GCST90091060; other heel measurements are also shown—heel broadband ultrasound attenuation (heel bua): NEALE2_3144_raw: direct entry and NEALE2_4120_raw: right); and heel quantitative ultrasound index (heel qui): NEALE2_3147_raw: direct entry and NEALE2_4123_raw: right.