
|
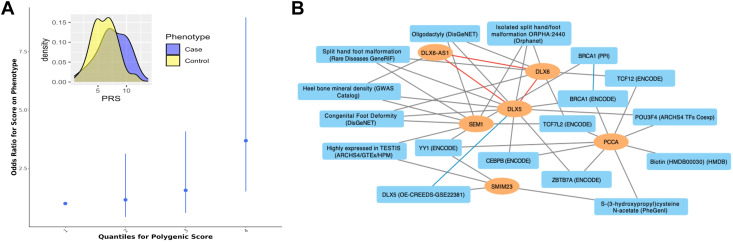
Fig. 2 Multilocus analysis of the top susceptibility loci. A. Polygenic risk score calculated using genome-wide association study summary statistics from our discovery cohort was used to predict the risk for coronal nonsyndromic craniosynostosis in the replication cohort. Best fit model was achieved by PRsice with 106 variants with association P < 5E−05. Inset: difference in means of Polygenic risk score values in the craniosynostosis cases (blue) and the control group (yellow) are shown. B. Knowledge graph connecting the identified genes with shared enriched functional terms from Enrichr. In the network, identified genes are represented as orange ovals, whereas shared enriched annotations from Enrichr are shown as blue rectangles. Known physical interactions between the protein products of the identified genes are depicted by red lines, connections to functional terms are depicted by gray lines, and related terms are connected by blue lines.