
|
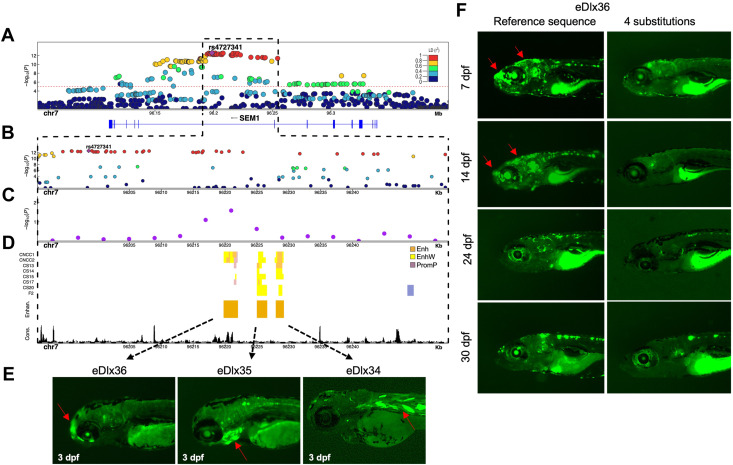
Fig. 4 Enhancer analysis of the SEM1 locus. A. A regional association plot surrounding the top risk variant, rs4727341 (shown as a purple diamond). The x axis represents a 0.2 Mb region, 100 kb upstream and downstream of the lead variant; the y axis shows −log10 P values for individual variant associations from the European meta-analysis annotated with the genes in the selected genomic interval. Pairwise linkage disequilibrium (LD) (r2) with the lead variant color coded based on the 1000 Genomes Project Phase 3 European reference samples. B. Zoom-in of the top signal region to highlight the rs4727341-LD region (r2 > 0.9) (dashed black box). The y axis shows −log10 P values for individual variant associations from the European meta-analysis as above. Pairwise LD (r2) with the lead variant color coded based on the 1000 Genomes Project Phase 3 European reference samples. C. Zoom-in genomic region annotated with −log10 P values for individual 6 kb sliding windows from rare variant TDT aggregate analysis of rare variants in family-based study (purple dots). The dot is represented at the start of each window. D. Predicted craniofacial regulatory elements near rs4727341. Histone modification marks are associated with active craniofacial predicted enhancers (CNCC1 through F2).13 Highlighted are 3 predicted enhancer candidates (Enhan.), eDlx34, eDlx35, and eDlx36, which were tested in this study (orange bar). Phylop conservation track (Cons.) from University of California Santa Cruz (UCSC) Genome Browser is shown in black color. E. Zebrafish enhancer assays at 3 days after fertilization (dpf). eDlx34 drove green fluorescent protein (GFP) expression in the heart and somitic muscles. eDlx35 drove specific GFP expression in the mandibular arch and branchial arches (basibranchials, hypobranchials, and ceratobranchial 1-5) and notochord. eDlx36 drove specific GFP expression in the premaxillary, maxillary, FNP, and apical region of the skull. F. The effect of 4 rare variants on the in vivo eDlx36 enhancer activity. GFP-positive cells drove by eDlx36 enhancer in the FNP and apical region of the skull at 7 and 14 dpf, whereas the mutated eDlx36 embryos showed low GFP expression and fewer GFP-positive embryos in the craniofacial tissues at 7,14, 24, and 30 dpf.