
|
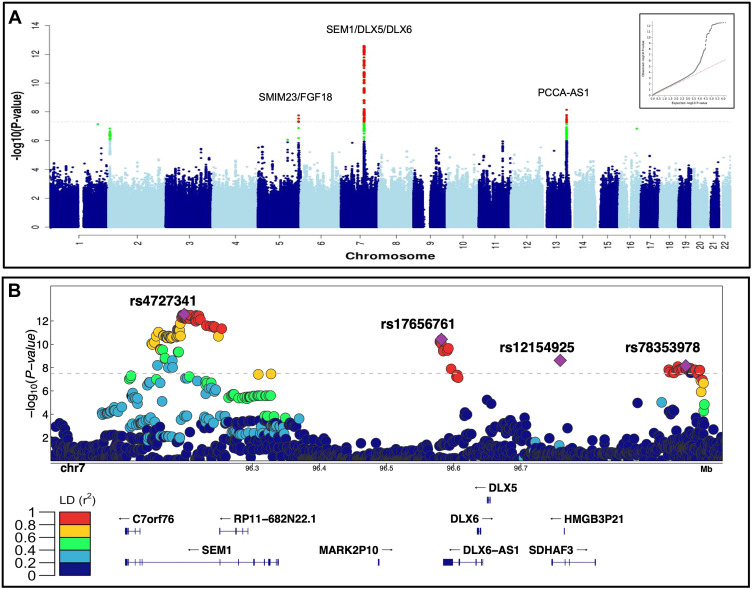
Fig. 1 Summary of the genome-wide analysis of coronal nonsyndromic craniosynostosis. A. Manhattan plot of the meta-analysis of discovery and replication genome-wide association analyses using common variants (minor allele frequency > 1%). The y-axis shows the −log10 transformed P value of each variant association found using a standard-error-weighted approach and controlling for population stratification, and the x-axis shows the chromosomal position. Variants crossing the genome-wide significance threshold of P < 5E−08 are color coded in red, and those with P < 5E−06 are in green. The top signals are annotated with the closest genes. Inset: quantile-quantile plot showing distribution of expected P values under the null model (red-dotted line) vs observed P values (black dots). B. Regional plot of the 4 top independent genomic association signals from the European meta-analyses. The y-axis shows −log10 P values for individual variants annotated with the genes in the selected genomic interval. The top variants are marked as purple diamonds and other variants in pairwise linkage disequilibrium (r2) with the top variant, based on the 1000 Genomes Project Phase 3 European reference samples, are color coded as per the scale in legend.