FIGURE SUMMARY
Title

TnP and AHR-CYP1A1 Signaling Crosstalk in an Injury-Induced Zebrafish Inflammation Model

Authors
Disner, G.R., Fernandes, T.A.M., Nishiyama-Jr, M.Y., Lima, C., Wincent, E., Lopes-Ferreira, M.
Source
Full text @ Pharmaceuticals (Basel)

TnP suppresses CYP1A1 activity in vitro. The effect of TnP (82.5 nM–660 µM) on the enzyme activity revealed the 50% inhibitory concentration (IC50) as 199.1 µM. Analysis of log(inhibitor) vs. response—variable slope performed by GraphPad Prism Software (San Diego, CA, USA).

TnP sustains Cyp1a expression induced by FICZ. (A) Fluorescence intensity analysis measured by ImageJ of Tg(cyp1a:EGFP) zebrafish reporter embryos treated with FICZ and/or TnP to assess cyp1a expression over time, with exposure to the compounds starting at 24 h post-fertilization (hpf). DMSO 0.01% v/v was used as a negative control. Graph produced using GraphPad Prism Software (San Diego, CA, USA). * represents a significant difference (p < 0.05) to the negative control (DMSO), and # represents a significant difference (p < 0.05) to FICZ. (B) Selected representations of Tg(cyp1a:EGFP) zebrafish reporter embryos to assess the intensity and spatial distribution of AHR activation through Cyp1a expression at 96 h post-treatment (hpt). Abbreviations: FICZ—6-Formylindolo[3,2-b]carbazole; TnP—Thalassophryne nattereri Peptide; DMSO—Dimethyl Sulfoxide.

TnP enhances Cyp1a1 expression in zebrafish embryos. The expression level was assessed by qPCR at 96 h post-treatment, where embryos were treated with 10 nM 6-Formylindolo[3,2-b]carbazole (FICZ) and/or TnP (66 and 199.1 µM). Exposure to chemicals starting at 24 h post-fertilization (hpf). DMSO 0.01% v/v was used as negative control (NC). * p < 0.05 with NC (DMSO); # p < 0.05 with positive control (10 nM FICZ). Produced using GraphPad Prism Software (San Diego, CA, USA).

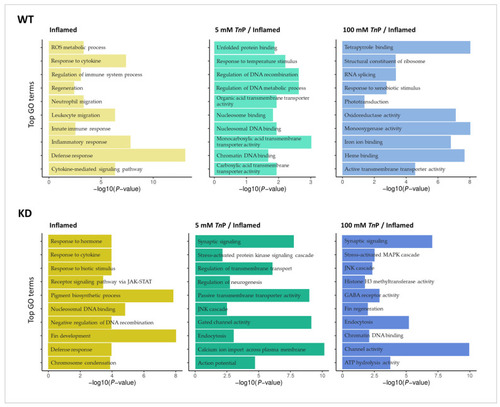
Transcriptomic analysis in a zebrafish inflammation model treated with
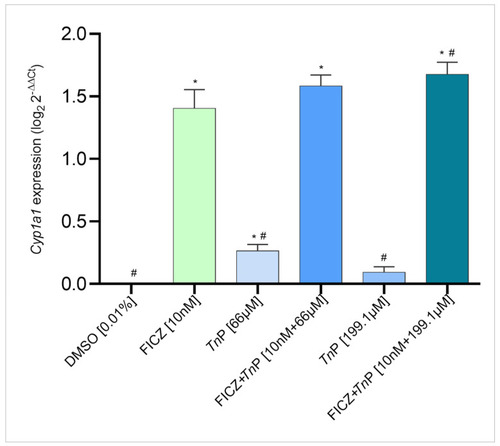
 TnP. (A) Experimental design comprising Ahr2-knockdown (KD), TnP prophylactic treatment, and injury-induced inflammation model by tail fin amputation. (B) Principal component analysis (PCA) for the overall distribution of the datasets; the ellipses limit the 95% confidence interval among biological replicates. (C) Hierarchical clustering heatmap depicting gene transcription patterns; adjust p-value < 0.05 and log2 fold change ±0.5. (D) Bar plots illustrating the differentially expressed genes (DEGs) between pairwise comparisons in both genotypes. (E) Venn diagrams of the overlapping and distinct DEGs in KD and wild-type (WT) groups modulated by TnP under inflammatory conditions.

Effect of TnP in a zebrafish inflammation model in wild-type (WT) or Ahr2-knockdown (KD) embryos observed through Gene Ontology (GO) enrichment analysis. The bar plots illustrate top enriched biological processes and molecular functions for differentially expressed genes between the following pairwise comparisons: inflamed vs. control (inflamed); treatment with TnP 5/inflamed vs. inflamed (5 mM TnP/inflamed); and treatment with TnP 100/inflamed vs. inflamed (100 mM TnP/inflamed).

Effect of TnP in a zebrafish inflammation model in wild-type (WT) or Ahr2-knockdown (KD) embryos observed through Kyoto Encyclopedia of Genes and Genomes (KEGG) enrichment analysis. The dot plot presents the list of enriched KEGG pathways based on differentially expressed genes between the following pairwise comparisons: inflamed vs. control (inflamed); treatment with TnP 5/inflamed vs. inflamed (5 mM TnP/inflamed); and treatment with TnP 100/inflamed vs. inflamed (100 mM TnP/inflamed) for both genotypes, i.e., wild-type (WT) and Ahr2-knockdown (KD).

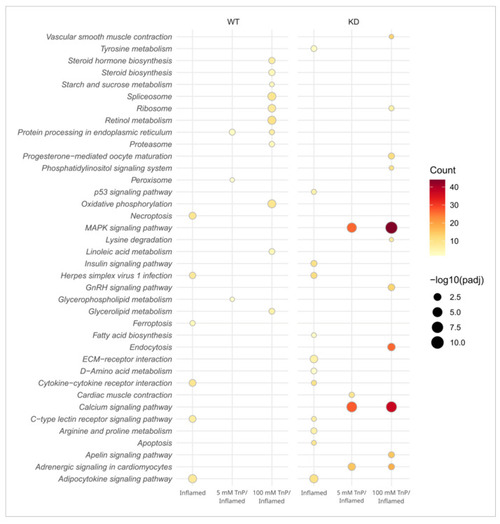
Dot plot illustrating the effect of TnP treatment and inflammation in the expression profile of specific genes, in wild-type (WT) and Ahr2-knockdown (KD) embryos. These genes are known to regulate drug transport and metabolism (phase I and II), oxidative stress, and inflammatory response in the pairwise comparisons: inflamed vs. control (inflamed); treatment with TnP 5/inflamed vs. inflamed (5 mM TnP/inflamed); and treatment with TnP 100/inflamed vs. inflamed (100 mM TnP/inflamed) obtained from the RNAseq dataset. The dots represent statistically significant differences (adjust p-value < 0.05, log2FC ± 0.5), and their absence means no difference for that gene expression in the due comparison.

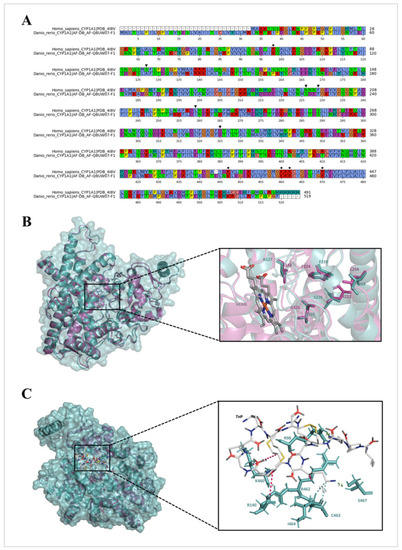
Structure comparison and molecular docking simulations. (A). Primary structure alignment of Homo sapiens CYP1A1 (PDB: 4I8V) and Danio rerio CYP1A1 (AF-DB: AF-Q8UW07-F1). The numbering below the sequences is in accordance with the D. rerio CYP1A1 sequence. The residues involved in the active site are labeled by a downward-pointing triangle (▾), and the TnP-binding residues are indicated by asterisks (*). The residues were colored according to Clustal Omega scheme: blue (hydrophobic—A, I, L, M, F, W, and C), red (positively charged—K and R), magenta (negatively charged—E and D), green (polar—N, Q, S, and T), pink (cysteine—C), orange (glycine—G), yellow (proline—P), and cyan (aromatic—H and Y). No present amino acids are indicated by a hyphen (-). (B). Tertiary structure comparison between human (purple) and zebrafish (blue) CYP1A1 proteins. On the right side, the active site residues and the heme group are shown in sticks, with the carbon, hydrogen, nitrogen, and oxygen atoms in gray, white, blue, and red, respectively. (C). Molecular docking of TnP on H. sapiens and D. rerio CYP1A1 proteins. The ligand interactions are exhibited on the right side. The peptide is shown in lines with the carbon, hydrogen, nitrogen, and oxygen atoms in gray, white, blue, and red, respectively. The conventional hydrogen bonds, carbon hydrogen bonds, and hydrophobic interactions are shown in green, blue, and pink, respectively.

Acknowledgments
This image is the copyrighted work of the attributed author or publisher, and ZFIN has permission only to display this image to its users. Additional permissions should be obtained from the applicable author or publisher of the image. Full text @ Pharmaceuticals (Basel)