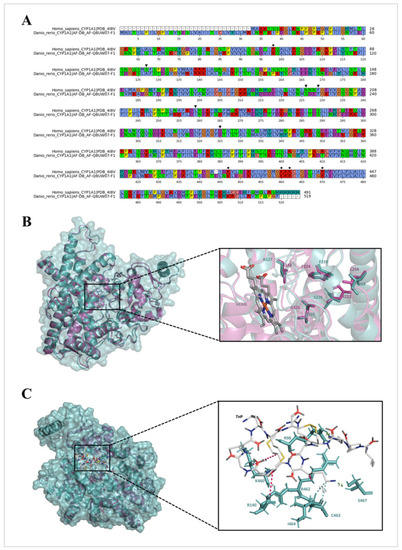
Structure comparison and molecular docking simulations. (A). Primary structure alignment of Homo sapiens CYP1A1 (PDB: 4I8V) and Danio rerio CYP1A1 (AF-DB: AF-Q8UW07-F1). The numbering below the sequences is in accordance with the D. rerio CYP1A1 sequence. The residues involved in the active site are labeled by a downward-pointing triangle (▾), and the TnP-binding residues are indicated by asterisks (*). The residues were colored according to Clustal Omega scheme: blue (hydrophobic—A, I, L, M, F, W, and C), red (positively charged—K and R), magenta (negatively charged—E and D), green (polar—N, Q, S, and T), pink (cysteine—C), orange (glycine—G), yellow (proline—P), and cyan (aromatic—H and Y). No present amino acids are indicated by a hyphen (-). (B). Tertiary structure comparison between human (purple) and zebrafish (blue) CYP1A1 proteins. On the right side, the active site residues and the heme group are shown in sticks, with the carbon, hydrogen, nitrogen, and oxygen atoms in gray, white, blue, and red, respectively. (C). Molecular docking of TnP on H. sapiens and D. rerio CYP1A1 proteins. The ligand interactions are exhibited on the right side. The peptide is shown in lines with the carbon, hydrogen, nitrogen, and oxygen atoms in gray, white, blue, and red, respectively. The conventional hydrogen bonds, carbon hydrogen bonds, and hydrophobic interactions are shown in green, blue, and pink, respectively.
|
