IMAGE

Figure 7

ID
ZDB-IMAGE-240930-68
Source
Figures for Disner et al., 2024
Image
Figure Caption

Figure 7

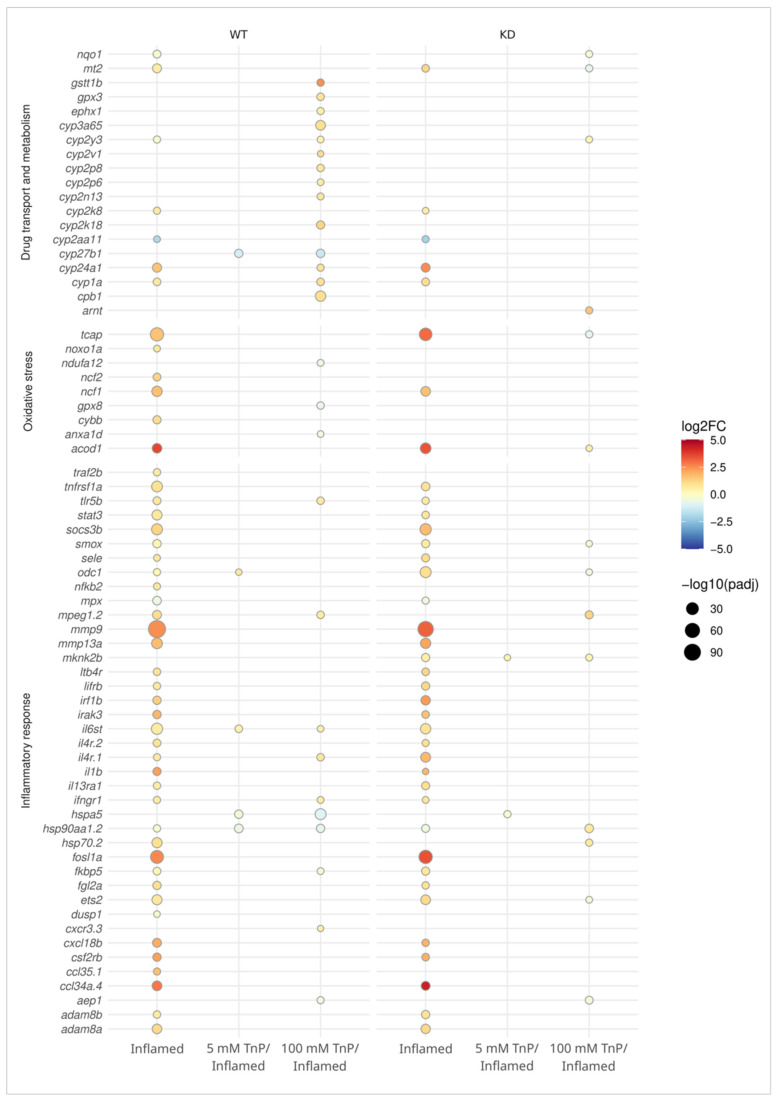
Dot plot illustrating the effect of TnP treatment and inflammation in the expression profile of specific genes, in wild-type (WT) and Ahr2-knockdown (KD) embryos. These genes are known to regulate drug transport and metabolism (phase I and II), oxidative stress, and inflammatory response in the pairwise comparisons: inflamed vs. control (inflamed); treatment with TnP 5/inflamed vs. inflamed (5 mM TnP/inflamed); and treatment with TnP 100/inflamed vs. inflamed (100 mM TnP/inflamed) obtained from the RNAseq dataset. The dots represent statistically significant differences (adjust p-value < 0.05, log2FC ± 0.5), and their absence means no difference for that gene expression in the due comparison.

Acknowledgments
This image is the copyrighted work of the attributed author or publisher, and ZFIN has permission only to display this image to its users. Additional permissions should be obtained from the applicable author or publisher of the image. Full text @ Pharmaceuticals (Basel)