IMAGE

Figure 4

ID
ZDB-IMAGE-240930-65
Source
Figures for Disner et al., 2024
Image
Figure Caption

Figure 4

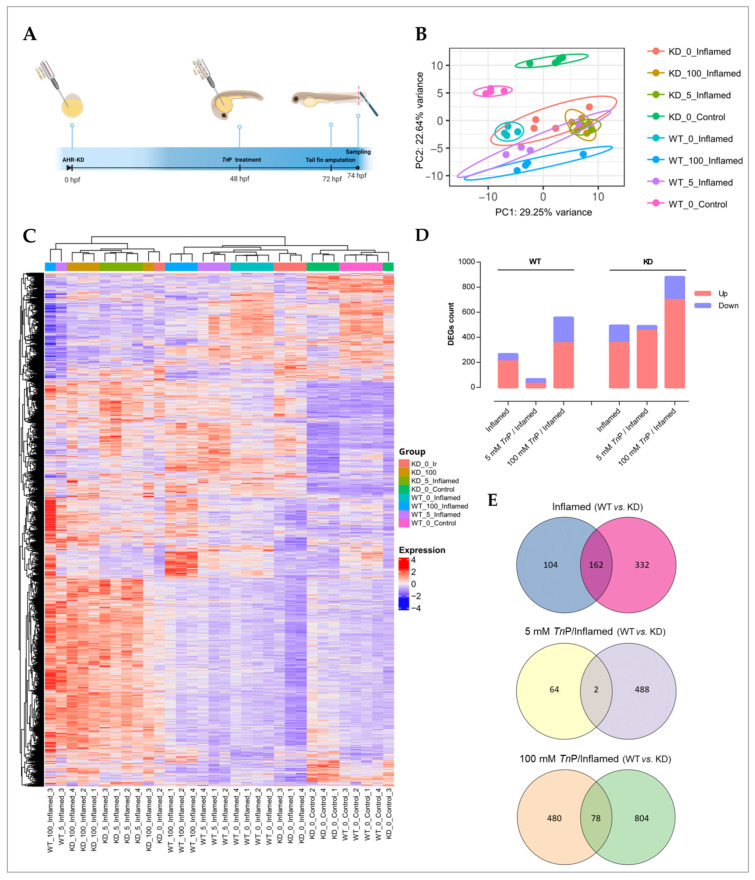
Transcriptomic analysis in a zebrafish inflammation model treated with TnP. (A) Experimental design comprising Ahr2-knockdown (KD), TnP prophylactic treatment, and injury-induced inflammation model by tail fin amputation. (B) Principal component analysis (PCA) for the overall distribution of the datasets; the ellipses limit the 95% confidence interval among biological replicates. (C) Hierarchical clustering heatmap depicting gene transcription patterns; adjust p-value < 0.05 and log2 fold change ±0.5. (D) Bar plots illustrating the differentially expressed genes (DEGs) between pairwise comparisons in both genotypes. (E) Venn diagrams of the overlapping and distinct DEGs in KD and wild-type (WT) groups modulated by TnP under inflammatory conditions.

Acknowledgments
This image is the copyrighted work of the attributed author or publisher, and ZFIN has permission only to display this image to its users. Additional permissions should be obtained from the applicable author or publisher of the image. Full text @ Pharmaceuticals (Basel)