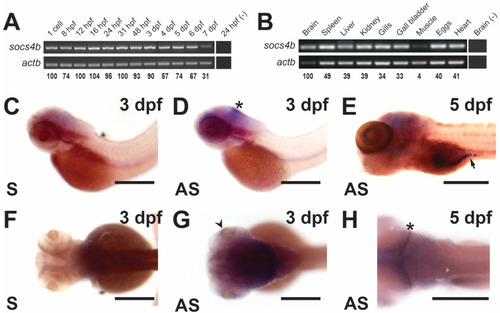
Spatio-temporal expression profile of the zebrafish socs4b gene. Semi-quantitative RT-PCR analysis of socs4b and the control actb gene using total RNA extracted from embryos at the indicated times post-fertilization (A) or from the indicated microdissected adult tissues (B). Individual bands were quantified to calculate the relative ratio of socs4b:actb that is shown below each panel, with the first sample set at 100% in each case. Whole-mount in situ hybridization analysis of socs4b on embryos at 3 dpf (C,D,F,G) and 5 dpf (E,H) using either sense (S) or anti-sense (AS) socs4b probes, as indicated, imaged either laterally (CE) or dorsally (FH). Asterisks indicate staining in the brain in panels (D,H), the arrowhead indicates staining in the retina in panel (G), and the arrow staining in the intestine in panel (E). Scale bars = 0.5 mm.

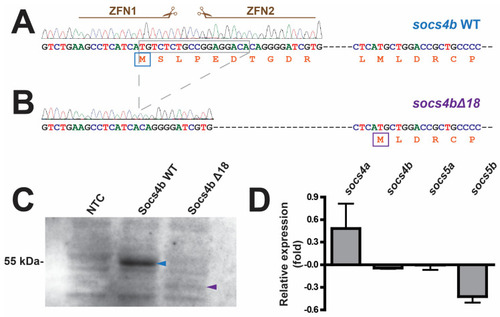
Zinc-finger nuclease-mediated targeting of the zebrafish socs4b gene and evaluation of the socs4bΔ18 mutation. Sequence of zebrafish socs4b WT (A) and socs4bΔ18 (B) alleles, including the corresponding chromatograms, with the sequences targeted by the zinc-finger nuclease (ZFN) pair indicated and the nucleotides deleted in the socs4bΔ18 mutant shown by the grey box. Hyphens represent 258 nucleotides of intervening sequences prior to the first in-frame methionine. The respective protein translations are presented below, with the native start methionine of Socs4b WT indicated by a blue box and the next in-frame methionine in Socs4bΔ18 with a purple box. In vitro transcription/translation analysis of Socs4b WT and Socs4bΔ18 sequences along with a no template control (NTC) (C). The blue arrowhead indicates full-length Socs4b WT protein product and the purple arrowhead indicates the truncated Socs4bΔ18 protein product. Quantitative RT-PCR analysis of the socs4a, socs4b, socs5a, and socs5b genes performed on total RNA extracted from socs4b WT and socs4bΔ18 embryos, expressed as a fold-change socs4bΔ18 relative to socs4b WT embryos, with error bars indicating the standard error of the mean (D). Statistical analysis determined all differences as p > 0.05. Original blot can be found in Supplementary Figure S2.

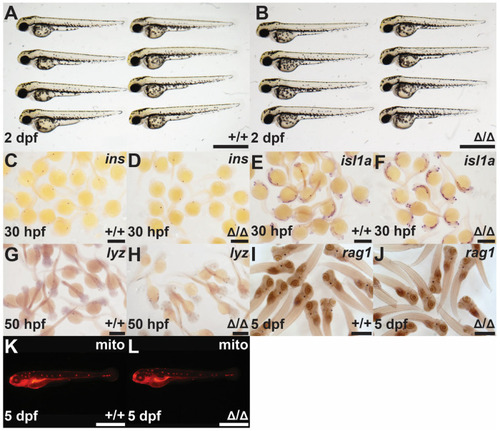
Investigation of the socs4bΔ18 mutants. Light microscopy of homozygous socs4b WT (+/+; (A)) and socs4bΔ18 (Δ/Δ; (B)) embryos at 2 dpf. Homozygous socs4b WT (+/+; (C,E,G,I,K)) and socs4bΔ18 (Δ/Δ; (D,F,H,J,L)) embryos subjected to WISH at the indicated times with specific probes for ins ((C), n = 35; (D), n = 33), isl1a ((E), n = 42; (F), n = 38), lyz ((G), n = 27; (H), n = 30), and rag1 ((I), n = 40; (J), n = 37) viewed by light microscopy or staining with Mitotracker Red (mito) ((K), n = 23; (L), n = 25) and viewed by fluorescence microscopy. The number of embryos analyzed with each stain is shown. Scale bars = 1 mm.

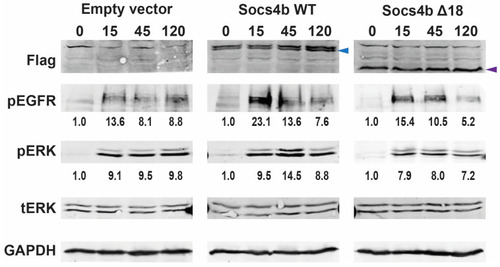
Analysis of the impact of zebrafish Socs4b on EGFR signaling. HEK293T cells transfected with empty vector control or plasmids encoding Flag-tagged Socs4b WT or Socs4b Δ18 were stimulated with EGF for the time indicated (min). Protein was extracted and subjected to Western blot analysis with antibodies against the Flag-tag to confirm expression of the Socs4b forms, as well as to pEGFR and pERK to detect EGFR signaling, along with tERK and glyceraldehyde 3-phosphate dehydrogenase (GAPDH) that served as loading controls. The position of Flag-tagged Socs4b WT and Socs4b Δ18 proteins are shown with blue and purple arrowheads, respectively. Bands were quantified and the relative ratio of pEGFR:GAPDH and pERK:tERK calculated and shown below the relevant panel, with the 0 min sample set at 1.0 in each case, showing the average of two independent replicates. Original blots can be found in Supplementary Figure S4.

Acknowledgments
This image is the copyrighted work of the attributed author or publisher, and ZFIN has permission only to display this image to its users. Additional permissions should be obtained from the applicable author or publisher of the image. Full text @ Biomolecules