IMAGE

Figure 1

ID
ZDB-IMAGE-240930-144
Source
Figures for Trengove et al., 2024
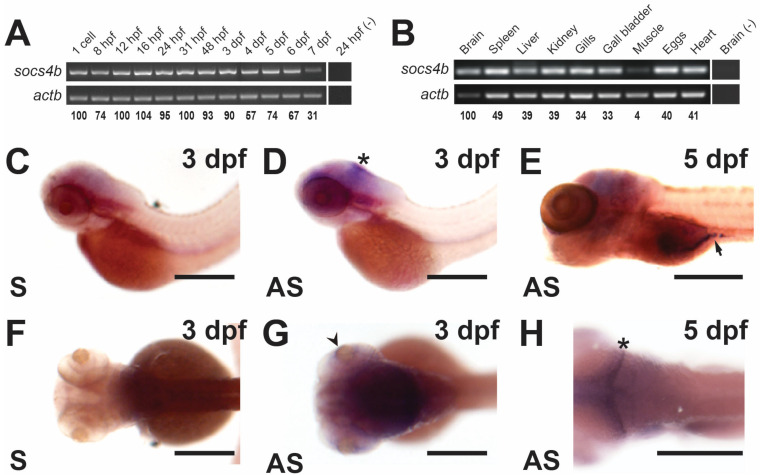
Image
Figure Caption

Figure 1

Spatio-temporal expression profile of the zebrafish socs4b gene. Semi-quantitative RT-PCR analysis of socs4b and the control actb gene using total RNA extracted from embryos at the indicated times post-fertilization (A) or from the indicated microdissected adult tissues (B). Individual bands were quantified to calculate the relative ratio of socs4b:actb that is shown below each panel, with the first sample set at 100% in each case. Whole-mount in situ hybridization analysis of socs4b on embryos at 3 dpf (C,D,F,G) and 5 dpf (E,H) using either sense (S) or anti-sense (AS) socs4b probes, as indicated, imaged either laterally (CE) or dorsally (FH). Asterisks indicate staining in the brain in panels (D,H), the arrowhead indicates staining in the retina in panel (G), and the arrow staining in the intestine in panel (E). Scale bars = 0.5 mm.

Acknowledgments
This image is the copyrighted work of the attributed author or publisher, and ZFIN has permission only to display this image to its users. Additional permissions should be obtained from the applicable author or publisher of the image. Full text @ Biomolecules