FIGURE SUMMARY
Title

A modular chemigenetic calcium indicator for multiplexed in vivo functional imaging

Authors
Farrants, H., Shuai, Y., Lemon, W.C., Monroy Hernandez, C., Zhang, D., Yang, S., Patel, R., Qiao, G., Frei, M.S., Plutkis, S.E., Grimm, J.B., Hanson, T.L., Tomaska, F., Turner, G.C., Stringer, C., Keller, P.J., Beyene, A.G., Chen, Y., Liang, Y., Lavis, L.D., Schreiter, E.R.
Source
Full text @ Nat. Methods

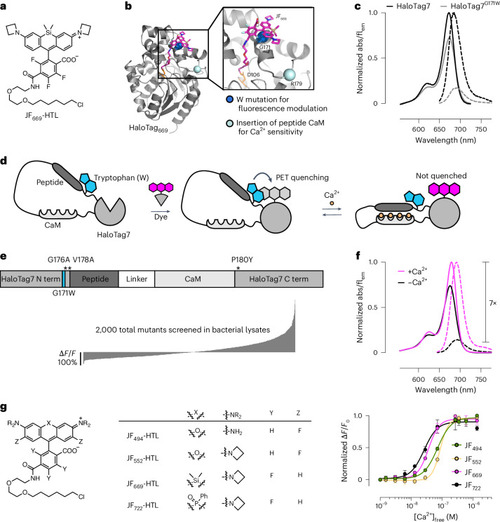
Engineering chemigenetic Ca2+ indicators with tryptophan quenching.

a, Chemical structure of the JF669-HaloTag ligand (HTL). b, Crystal structure of HaloTag7 bound to the JF669-HaloTag ligand (HaloTag669) (PDB 8SW8). The positions of G171, which was mutated to a tryptophan to quench dye fluorescence emission, and R179, where Ca2+-sensitive protein domains were inserted, are highlighted as spheres. c, Normalized absorption (abs; solid lines) and fluorescence emission (flem; dashed lines) spectra of the JF669-HaloTag ligand bound to HaloTag7 or the HaloTag7G171W mutant. d, Schematic representation of WHaloCaMP, showing domain arrangement, covalent binding of the dye-ligand and the quenching tryptophan. e, Primary structure of WHaloCaMP1a (top) and ∆F/F0 values of variants (bottom) from a bacterial lysate screen to select WHaloCaMP1a. Term, terminus. f, Normalized absorption (solid lines) and fluorescence emission (dashed lines) spectra of the JF669-HaloTag ligand bound to purified WHaloCaMP1a in the presence (magenta) and absence (black) of Ca2+. g, Chemical structures of the dye-ligands used here with WHaloCaMP1a (left) and normalized Ca2+ titrations of WHaloCaMP1a bound to these dye-ligands (right). Data points represent mean and s.d. from n = 3 replicates. [Ca2+], Ca2+ concentration.

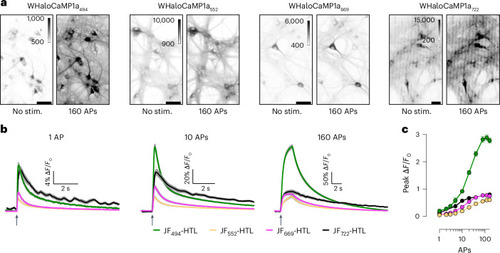
Characterization of WHaloCaMP1a in neuronal cultures.

a, Representative images of cultured rat hippocampal neurons expressing WHaloCaMP1a labeled with dye-ligands unstimulated or stimulated with 160 induced APs. Scale bars, 50 µm. Stim., stimulation. b, The ∆F/F0 response of WHaloCaMP1a expressed in cultured rat hippocampal neurons and labeled with the indicated dye-ligands to trains of APs. Solid line (mean) and gray outline (s.e.m.) for n = 153, 168 and 141 neurons for the JF494-HaloTag ligand, the JF552-HaloTag ligand and the JF669-HaloTag ligand and for n = 20 for the JF722-HaloTag ligand. Black arrows indicate the start of stimulation. c, Peak ∆F/F0 as a function of the number of APs. Data are presented as mean and s.e.m. for n = 153, 168 and 141 neurons for the JF494-HaloTag ligand, the JF552-HaloTag ligand and the JF669-HaloTag ligand and for n = 20 for the JF722-HaloTag ligand. APs were elicited with a field stimulation electrode with a pulse width of 1 ms at 80 Hz and 40 V.

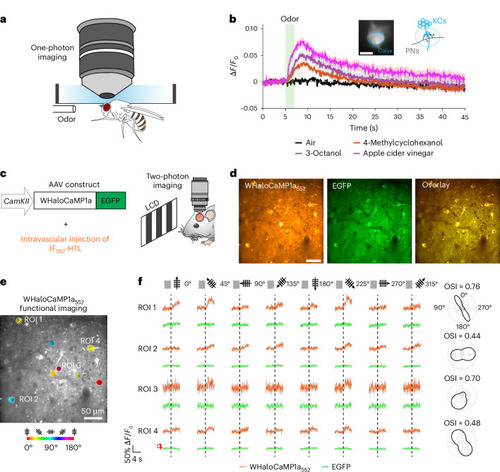
WHaloCaMP1a reports on neuronal activity in flies and mice.

a, One-photon imaging setup of head-fixed flies expressing WHaloCaMP1a labeled with dye-ligands. b, Fluorescence responses from WHaloCaMP1a669 in head-fixed flies presented with different odors. WHaloCaMP1a was expressed in mushroom body KCs. Images were acquired from the calyx, where KCs receive dendritic inputs from the olfactory projection neurons (PNs) (insets). Green shading indicates odor presentation for 2 s. Data were from six flies, and odors were presented three times to each fly. The thick line and the shaded areas indicate means and s.e.m. across odor trials. Scale bar, 50 µm. c, AAV construct for transducing neurons in the mouse V1 and the schematic of the experimental setup for two-photon functional imaging of WHaloCaMP1a in the visual cortex of mice. The JF552-HaloTag ligand was intravascularly injected 1 d before examining orientation selectivity of V1 neurons in the anesthetized mouse exposed to moving grafting visual stimuli of different orientations and directions. LCD, liquid crystal display. d, Representative images of a field of view in the mouse V1 showing neurons expressing WHaloCaMP1a552 or EGFP. Scale bar, 50 µm. e, Functional imaging of V1 neurons shows the orientation selectivity map. f, Functional imaging of Ca2+ (WHaloCaMP1a552 channel) or control (EGFP channel) traces (ROI 1–4) in response to drifting gratings in the directions shown above the traces. Average of five trials. Colored lines indicate means, and shadows indicate s.d. Orientation selectivity index (OSI) of cells is shown on the right. Imaging rate was 15 Hz. A representative imaging session from three imaging sessions is shown. The experiment was repeated independently 19 times in four mice with similar results.

Three-color multiplexed functional imaging in zebrafish larvae.

a, Light-sheet imaging setup for multiplexed imaging. b, Schematic of side-view zebrafish larvae highlighting the field of view for three-color multiplexed functional imaging of glucose and Ca2+ in muscles and neurons. c, Representative images of WHaloCaMP1a expressed in neurons from the elavl3 promoter, iGlucoSnFR expressed from the actb2 ubiquitous promoter and jRGECO1a expressed in muscle from the acta1a promoter. Scale bar, 50 µm. The experiment was repeated independently three times with similar results. d, Fluorescence ∆F/F0 traces of WHaloCaMP1a669, jRGECO1a and iGlucoSnFR in the ROI outlined in b. A representative experiment from three zebrafish larvae was imaged. e, Schematic of the zebrafish larva’s head indicating the field of view for light-sheet imaging of neuronal and astrocyte activity. f, Representative images of the expression patterns of WHaloCaMP1a669–EGFP expressed under the elavl3 promoter and jRGECO1b expressed under the gfap promoter. Scale bar, 50 µm. The experiment was repeated independently more than three times with similar results. g, Zoomed-in images showing single-cell resolution of fluorescent signals in the hindbrain. Scale bar, 20 µm. h, Images of Suite2p- and Cellpose-segmented cells from simultaneous functional imaging of WHaloCaMP1a669 and jRGECO1b. i, Rastermaps of activity from 1,228 segmented neurons (top) and 530 astrocytes (bottom) during spontaneous brain activity. Two neurons (n1 and n2) indicate the hindbrain oscillator. Two astrocytes (a1 and a1) are also indicated. j, The compound 4-AP was added to the imaging chamber of the zebrafish larva imaged in i, and functional imaging was performed. Concatenation of three imaging blocks of 6.2 min each. k, Fluorescence ∆F/F0 traces of n1 and n2 (top) and a1 and a2 (bottom) after addition of 4-AP.

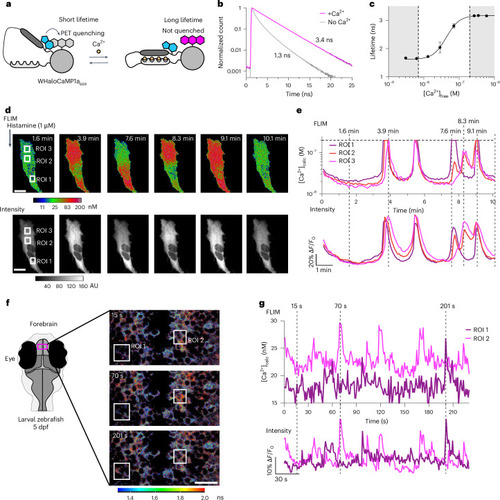
Quantitative Ca2+ measurements by FLIM using WHaloCaMP1a.

a, Schematic of WHaloCaMP1a bound to a dye-ligand used as a FLIM probe. Tryptophan quenching modulates the fluorescence lifetime. b, Normalized fluorescence lifetime of WHaloCaMP1a669 in the presence or the absence of Ca2+, fit to a three-component fluorescence decay. c, Calibration curve of the averaged fluorescence lifetime of WHaloCaMP1a669 versus Ca2+ concentration. The white box indicates the range in which WHaloCaMP1a669 can be used to make quantitative measurements of Ca2+ concentration. Performed with purified protein. Mean of three replicates and s.d. are plotted. d, Pseudocolored concentration (top) and intensity images (bottom) of WHaloCaMP1a669 in HeLa cells after histamine addition. Scale bar, 20 µm. Color bar indicates Ca2+ concentration, calculated from a calibration curve of fluorescence lifetime. AU, arbitrary units. e, Quantitative Ca2+ concentration calculated (calc) from a FLIM calibration curve (top) and fluorescence traces ∆F/F0 calculated from the intensity channel (bottom) in histamine-stimulated HeLa cells in the ROI highlighted in d. Calibrated WHaloCaMP1a669 can only be used to measure Ca2+ concentrations up to 200 nM, indicated by a dashed horizontal line. Vertical dashed lines indicate time points in the time series at which images in d are shown. f, FLIM of WHaloCaMP1a669 in live zebrafish larvae showing spontaneous neuronal activity in the forebrain. The experiment was repeated independently three times with similar results. Schematic indicating the field of view during imaging (left). Overlaid images of FLIM and intensity using Leica LAS X software, with a color bar indicating the fluorescence lifetime. Scale bar, 20 µm. g, Ca2+ concentrations calculated from a FLIM calibration curve (top) and fluorescence traces ∆F/F0 calculated from the intensity channel (bottom) over time for two neurons in the forebrain of zebrafish larvae from the ROI indicated in f. Dashed lines indicate time points of images in f. Representative images from three imaging sessions.

Acknowledgments
This image is the copyrighted work of the attributed author or publisher, and ZFIN has permission only to display this image to its users. Additional permissions should be obtained from the applicable author or publisher of the image. Full text @ Nat. Methods