FIGURE

Fig. 2

ID
ZDB-FIG-241017-76
Publication
Farrants et al., 2024 - A modular chemigenetic calcium indicator for multiplexed in vivo functional imaging
Other Figures
All Figure Page
Back to All Figure Page
Fig. 2

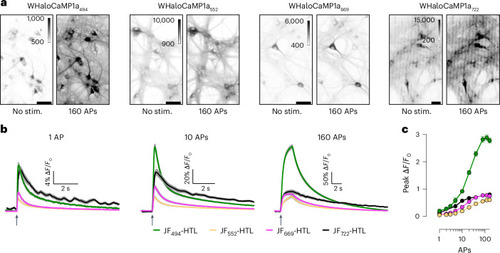
Characterization of WHaloCaMP1a in neuronal cultures.

a, Representative images of cultured rat hippocampal neurons expressing WHaloCaMP1a labeled with dye-ligands unstimulated or stimulated with 160 induced APs. Scale bars, 50 µm. Stim., stimulation. b, The ∆F/F0 response of WHaloCaMP1a expressed in cultured rat hippocampal neurons and labeled with the indicated dye-ligands to trains of APs. Solid line (mean) and gray outline (s.e.m.) for n = 153, 168 and 141 neurons for the JF494-HaloTag ligand, the JF552-HaloTag ligand and the JF669-HaloTag ligand and for n = 20 for the JF722-HaloTag ligand. Black arrows indicate the start of stimulation. c, Peak ∆F/F0 as a function of the number of APs. Data are presented as mean and s.e.m. for n = 153, 168 and 141 neurons for the JF494-HaloTag ligand, the JF552-HaloTag ligand and the JF669-HaloTag ligand and for n = 20 for the JF722-HaloTag ligand. APs were elicited with a field stimulation electrode with a pulse width of 1 ms at 80 Hz and 40 V.

Expression Data

Expression Detail
Antibody Labeling
Phenotype Data

Phenotype Detail
Acknowledgments
This image is the copyrighted work of the attributed author or publisher, and ZFIN has permission only to display this image to its users. Additional permissions should be obtained from the applicable author or publisher of the image. Full text @ Nat. Methods