
- Title
-
Deciphering metabolomics and lipidomics landscape in zebrafish hypertrophic cardiomyopathy model
- Authors
- Jacob, S., Abuarja, T., Shaath, R., Hasan, W., Balayya, S., Abdelrahman, D., Almana, K., Afreen, H., Hani, A., Nomikos, M., Fakhro, K., Elrayess, M.A., Da'as, S.I.
- Source
- Full text @ Sci. Rep.
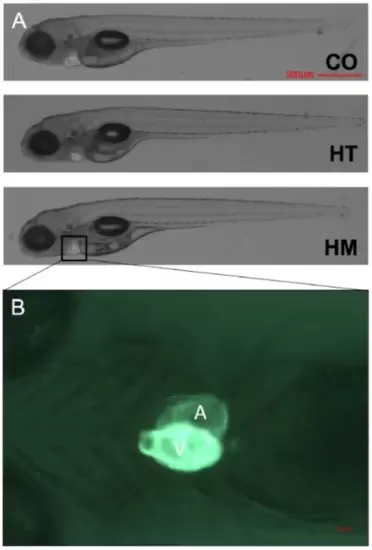
Representative images of the zebrafish larvae at 5 days old. (A) Representative lateral view of zebrafish larvae (control (CO), cmybpc3+/-::myl7:eGFP heterozygous (HT), and cmybpc3-/-::myl7:eGFP homozygous (HM))Transgenic reporter line myl7:egfp expressing green fluorescent two-chambered heart (500 μm scale bar). (B) A ventral view of HM heart at 168x high-magnification image captured using Axiozoom Zeiss stereomicroscope equipped with Axiocam camera, scale bar 50 μm. |

Hierarchical cluster analysis of fatty acids. Z-score clustering results for fatty acids are shown as a heatmap for all samples using MetaboAnalyst 5.0. The distance measure was Euclidean, and clustering method was Ward. The rows and columns are ordered so that similar groups and similar metabolites are close to one another. The fatty acids are present in the rows, and the sample groups in columns. Dark blue to dark red color gradient denotes lower to higher levels. On the top of the heatmap, the homozygous sample group is represented in blue, the heterozygous group in green and the control group in red. |

Principal components analysis (PCA) graph. The percentages on the axes represent the variation in the data set of the first two components. The points in the shaded regions represent the 95% confidence interval of each group and any overlaps between groups. The PCAs were generated using MetaboAnalayst 5.0 comparing between sample groups (control (CO), cmybpc3+/-::myl7:eGFP heterozygous (HT), and cmybpc3-/-::myl7:eGFP homozygous (HM). (A) Fatty Acids, (B) Acycarnitines, (C) Lipids and (D) Metabolites. |
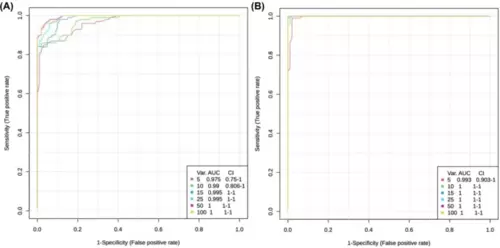
Receiver Operating Characteristics (ROC) curve for significant metabolites. ROC was generated by the Random Forest model using MetaboAnalyst 6.0, employing different number of features (5, 10, 15, 25, 50 and 100). The corresponding Area Under the Curve (AUC) value and confidence interval (CI) were determined for each set of features. (A) ROC curves of the cmybpc3-/-::myl7:eGFP homozygous (HM) vs. control (CO) model. (B) ROC curves of the cmybpc3+/-::myl7:eGFP heterozygous (HT) vs. HM model. |

Pathway enrichment analysis. Pathway enrichment analysis was done using MetaboAnalyst 5.0 and 6.0 using KEGG for species zebrafish (Danio rerio)63. The Y-axis shows the matched pathways according to the p-values from the pathway enrichment analysis and X-axis pathway impact values from the pathway topology analysis. The node color of each pathway is determined by the p-value (red = lowest p-value and highest statistical significance), and the node radius (size) is based on the pathway impact factor, with the biggest indicating the highest impact. Pathway enrichment analysis was done comparing (A) Homozygous and Control groups. (B) Homozygous and Heterozygous groups. Nicotinate and nicotinamide metabolism was significant in both Homozygous compared to Control and Heterozygous groups with p-values of 6.28E-6 and 2.65E-4, respectively. |