
|
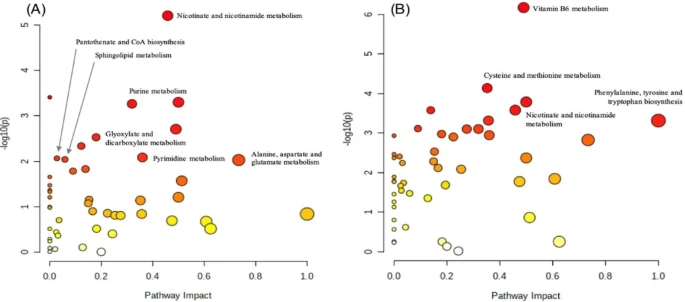
Fig. 5 Pathway enrichment analysis. Pathway enrichment analysis was done using MetaboAnalyst 5.0 and 6.0 using KEGG for species zebrafish (Danio rerio)63. The Y-axis shows the matched pathways according to the p-values from the pathway enrichment analysis and X-axis pathway impact values from the pathway topology analysis. The node color of each pathway is determined by the p-value (red = lowest p-value and highest statistical significance), and the node radius (size) is based on the pathway impact factor, with the biggest indicating the highest impact. Pathway enrichment analysis was done comparing (A) Homozygous and Control groups. (B) Homozygous and Heterozygous groups. Nicotinate and nicotinamide metabolism was significant in both Homozygous compared to Control and Heterozygous groups with p-values of 6.28E-6 and 2.65E-4, respectively.