
|
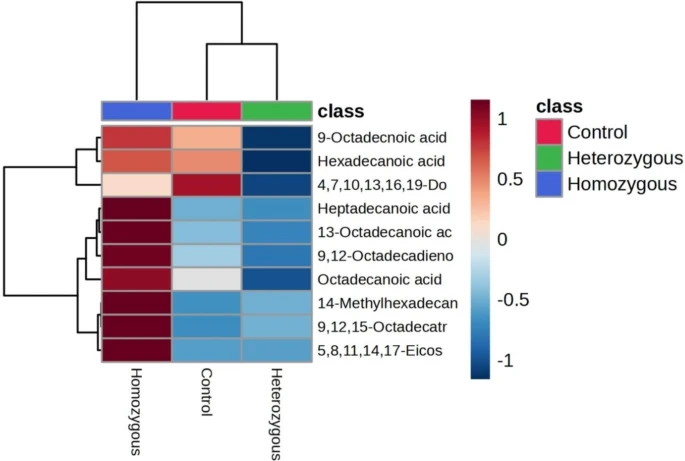
Fig. 2 Hierarchical cluster analysis of fatty acids. Z-score clustering results for fatty acids are shown as a heatmap for all samples using MetaboAnalyst 5.0. The distance measure was Euclidean, and clustering method was Ward. The rows and columns are ordered so that similar groups and similar metabolites are close to one another. The fatty acids are present in the rows, and the sample groups in columns. Dark blue to dark red color gradient denotes lower to higher levels. On the top of the heatmap, the homozygous sample group is represented in blue, the heterozygous group in green and the control group in red.