
FIGURE
Fig. 4
- ID
- ZDB-FIG-240930-23
- Publication
- Jacob et al., 2024 - Deciphering metabolomics and lipidomics landscape in zebrafish hypertrophic cardiomyopathy model
- Other Figures
- All Figure Page
- Back to All Figure Page
Fig. 4
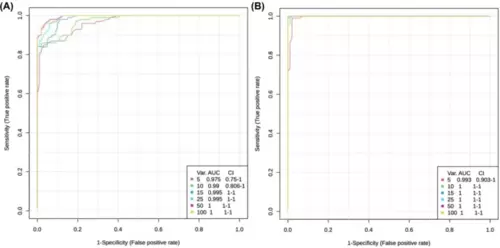
Receiver Operating Characteristics (ROC) curve for significant metabolites. ROC was generated by the Random Forest model using MetaboAnalyst 6.0, employing different number of features (5, 10, 15, 25, 50 and 100). The corresponding Area Under the Curve (AUC) value and confidence interval (CI) were determined for each set of features. (A) ROC curves of the cmybpc3-/-::myl7:eGFP homozygous (HM) vs. control (CO) model. (B) ROC curves of the cmybpc3+/-::myl7:eGFP heterozygous (HT) vs. HM model. |
Expression Data
Expression Detail
Antibody Labeling
Phenotype Data
Phenotype Detail
Acknowledgments
This image is the copyrighted work of the attributed author or publisher, and
ZFIN has permission only to display this image to its users.
Additional permissions should be obtained from the applicable author or publisher of the image.
Full text @ Sci. Rep.