
FIGURE
Fig. 1
- ID
- ZDB-FIG-240930-20
- Publication
- Jacob et al., 2024 - Deciphering metabolomics and lipidomics landscape in zebrafish hypertrophic cardiomyopathy model
- Other Figures
- All Figure Page
- Back to All Figure Page
Fig. 1
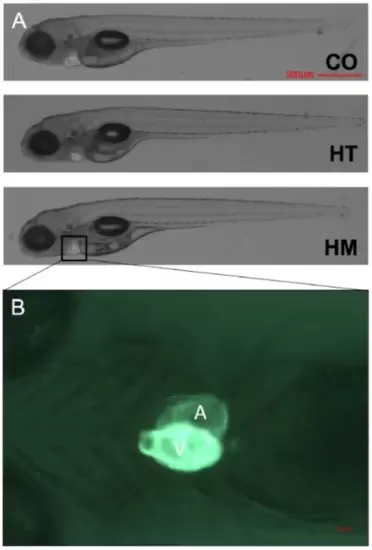
Representative images of the zebrafish larvae at 5 days old. (A) Representative lateral view of zebrafish larvae (control (CO), cmybpc3+/-::myl7:eGFP heterozygous (HT), and cmybpc3-/-::myl7:eGFP homozygous (HM))Transgenic reporter line myl7:egfp expressing green fluorescent two-chambered heart (500 μm scale bar). (B) A ventral view of HM heart at 168x high-magnification image captured using Axiozoom Zeiss stereomicroscope equipped with Axiocam camera, scale bar 50 μm. |
Expression Data
Expression Detail
Antibody Labeling
Phenotype Data
Phenotype Detail
Acknowledgments
This image is the copyrighted work of the attributed author or publisher, and
ZFIN has permission only to display this image to its users.
Additional permissions should be obtained from the applicable author or publisher of the image.
Full text @ Sci. Rep.