
- Title
-
Staphylococcus aureus lipid factors modulate melanoma cell clustering and invasion
- Authors
- Giese, M.A., Ramakrishnan, G., Steenberge, L.H., Dovan, J.X., Sauer, J.D., Huttenlocher, A.
- Source
- Full text @ Dis. Model. Mech.
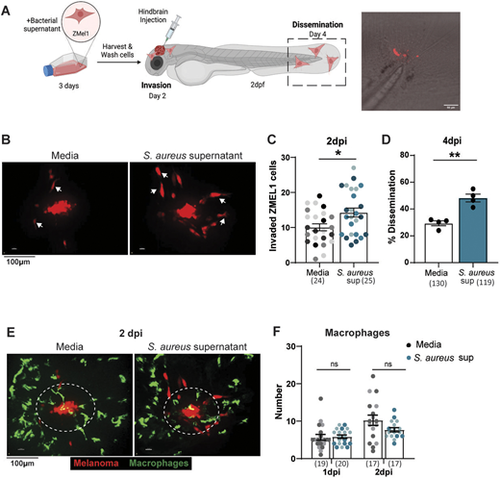
S. aureus supernatant promotes melanoma invasion and dissemination in vivo. (A) Schematic of ZMEL1-td-Tomato melanoma cell injection into larval zebrafish hindbrain, created with BioRender.com. Representative image of ZMEL1 dissemination to tail fin of 4dpi zebrafish larvae. Confocal imaging was performed in the hindbrain at 2 days post injection (dpi) and in the tail at 4 dpi. (B,C) Representative images of ZMEL1 melanoma cell invasion (B) and quantification of ZMEL1 melanoma cell invasion (C) at 2 dpi in the zebrafish hindbrain after culture in medium alone (Media) or in S. aureus USA300 supernatant. Arrows in B indicate migrated melanoma cells with an elongated morphology. Results are from three independent experiments (n=24-25 larvae per condition). Dots in C represent independent larvae color coded per replicate. (D) Percent of zebrafish with disseminated ZMEL1 melanoma cells in the tailfin at 4 dpi. Results are from three independent experiments (n=130 larvae for medium control, n=119 larvae with S. aureus supernatant). Dots represent independent replicates. Error bars indicate the mean±s.e.m. (E,F) Representative images of macrophage recruitment to ZMEL1 melanoma cells (E) and quantification of macrophage recruitment to ZMEL1 melanoma cells (F) at 2 dpi. Areas surrounded by dashed line indicate the 50-μm region within which recruited immune cells were counted Results are from two independent experiments (n=17-20 larvae per condition). Error bars indicate the mean±s.e.m.. P-values were calculated using unpaired t-test (C), paired t-test (D) or two-way ANOVA (F). *P<0.05; **P<0.01, ns, not significant. |
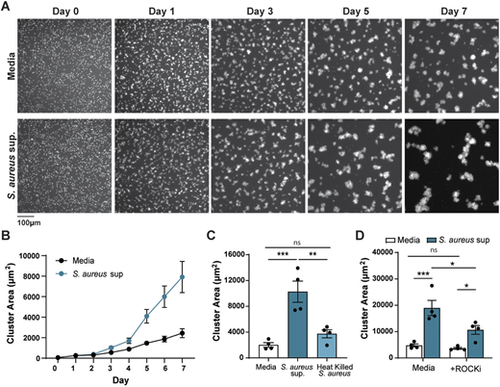
S. aureus supernatant promotes melanoma clustering in vitro. (A) Representative images of ZMEL1-EGFP melanoma cells cultures in the presence of medium alone (Media) or S. aureus USA300 supernatant imaged over 7 days. (B) Plot shows one representative experiment with quantification of melanoma cluster area (µm2) over time. Error bars indicate represent mean±s.e.m. (C,D) Melanoma cluster size (µm2) with S. aureus USA300 supernatant or heat killed bacteria (C) at 7 days or with S. aureus USA300 supernatant plus 500 nM of the ROCK inhibitor Y-27632 (D) at 7 days. Experiments were conducted at least three times. Dots in C and D represent independent replicates. Error bars indicate the mean±s.e.m. P-values were calculated by one-way ANOVA (C) or two-way ANOVA (D). *P<0.05; **P<0.01; ***P<0.001. ns, not significant. |
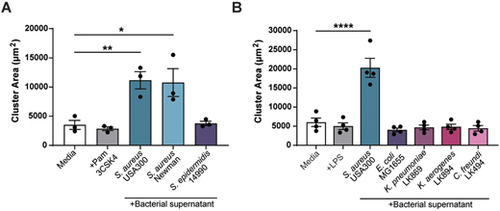
Melanoma clustering is specific to S. aureus species. Quantification of ZMEL1 melanoma cell cluster size (µm2) after 7 days of culture in either RPMI medium alone (Media) or in RMPI medium plus bacterial supernatant. (A) RPMI medium alone (Media), or with addition of Pam3CSK4 (100 µg/ml) or with one of the bacterial supernatants obtained from a selection of cultured Gram-positive bacteria as indicated was added to melanoma cell culture. (B) RPMI medium alone (Media), Media plus LPS (1 µg/ml) or with one of the bacterial supernatants obtained from a selection of cultured Gram-negative bacteria as indicated was added to melanoma cell culture. Experiments were conducted at least three times. Dots represent independent replicates. Error bars indicate the mean±s.e.m. P-values were calculated by one-way ANOVA. *P<0.05; **P<0.01; ****P<0.0001. |
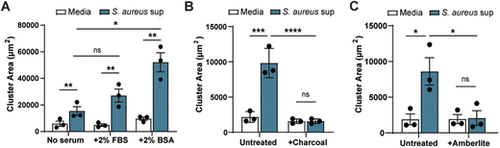
S. aureus effect on melanoma clustering is likely to be mediated by lipids. Quantification of ZMEL1 melanoma cell cluster size (µm2) after 7 days of culture in medium alone or plus S. aureus USA300 bacterial supernatant. (A) Supernatants were collected from S. aureus USA300 bacteria grown in RPMI medium alone Media), or RPMI medium supplemented with either 2% FBS or 2% BSA followed by culturing with melanoma cells. (B) Supernatants collected from S. aureus USA300 bacteria grown in RPMI medium alone (Media) were left untreated or treated with dextran-coated charcoal (+Charcoal) followed by culturing with melanoma cells. (C) Supernatants collected from S. aureus USA300 bacteria grown in RPMI medium alone (Media) were left untreated or treated with Amberlite-XAD4 (+Amberlite) followed by culturing with melanoma cells. Experiments were conducted at least three times. Dots represent independent replicates. Error bars indicate the mean±s.e.m. P-values were calculated by two-way ANOVA. **P<0.01; ***P<0.001; ****P<0.0001. ns, not significant. |
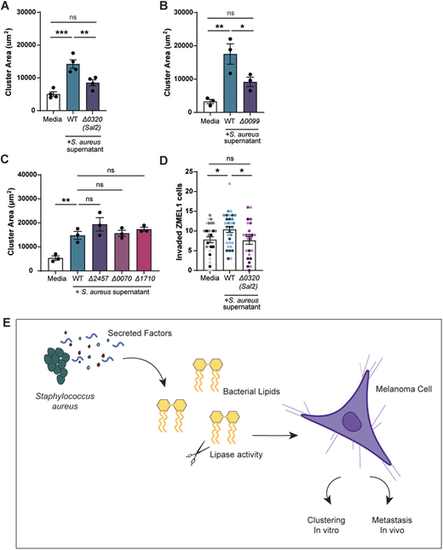
Deletion of S. aureus lipases alters melanoma clustering and invasion. Quantification of ZMEL1 melanoma cell cluster size (µm2) after 7 days of culture in RPMI medium alone or plus S. aureus USA300 bacterial supernatant as indicated. (A–C) Supernatants were tested from USA300 transposon mutants for lipases Sal2/Geh (Δ0320) (A), phosphatidylinositol-specific phospholipase C (Δ0099) (B) or for putative phospholipase genes Δ2457, Δ0070 and Δ1710 (C). PRMI medium alone (Media) was used as control. (D) ZMEL1 invasion at 2 dpi in the zebrafish hindbrain after culture in medium alone or in S. aureus USA300 supernatant. Dots represent independent larvae color coded per replicate. Medium control (n=30 larve); WT bacterial supernatant (n=32 larvae); Δ0320 supernatant (n=24 larvae). Experiments were conducted at least three times. Dots in A-C represent independent replicates. Error bars indicate the mean±s.e.m. P-values were calculated by one-way ANOVA (A–D). *P<0.05; **P<0.01; ***P<0.001. ns, not significant. (E) Schematic summarizing the findings described in this article, showing that S. aureus secreted factors promote melanoma clustering in vitro and invasion in vivo. |