
- Title
-
Androgen receptor activation inhibits endothelial cell migration in vitro and angiogenesis in vivo
- Authors
- Huo, Y.N., Yang, H.Y., Ke, H.Y., Lin, C.Y., Tsai, C.S.
- Source
- Full text @ Eur. J. Cell Biol.
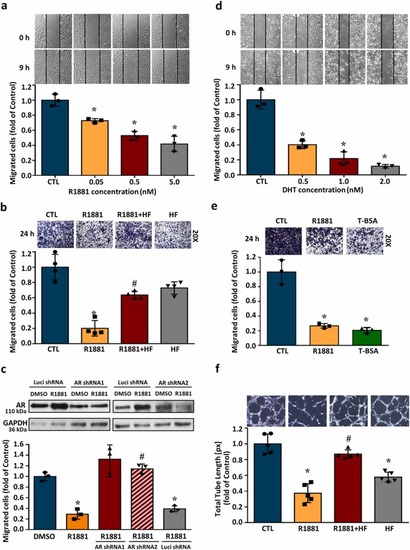
AR activation reduces the migration activity in HUVECs. The cell migration was examined at 9 h after treatment with R1881, DHT or T-BSA using wound healing assay. (a) R1881 (0.05–5.0 nM) concentration-dependently reduced HUVECs migration. Top panel: representative photographs of wound healing migration assay. Bottom panel: quantified results expressed by fold of control. (b) The effect of R1881 on HUVECs transwell migration capacity stained with crystal violet at 24 h (200-fold magnification). The R1881 (5 nM)-reduced endothelial migration was abolished by pre-treatment with HF (5 nM), an AR inhibitor. (c) AR expression was knocked down by AR shRNA (Top panel). The R1881-induced migration inhibition in HUVECs was abolished by knockdown of AR using the shRNA technique. (d) DHT (0.5–2.0 nM) concentration-dependently reduced HUVECs migration. Top pane: representative photographs of wound healing migration assay. Bottom panel: quantified results expressed by fold of control. (e) The effects of R1881 on cell migration detected by transwell assay at 24 h. Treatment with membrane-impermeable T-BSA significantly reduced the migrated cell number in HUVECs. (f) Treatment with R1881 (5 nM) for 4 h reduced the capillary-like tube formation, and this effect was abolished by pre-treatment with HF (5 nM). Values represent the means ± s.e.mean. (n = 3). *p<0.05 different from DMSO-treated group. #p < 0.05 different from the R1881-treated group. DHT, dihydrotestosterone; HF, hydroxyflutamide; shRNA, short hairpin RNA; T-BSA, testosterone-bovine serum albumin. |
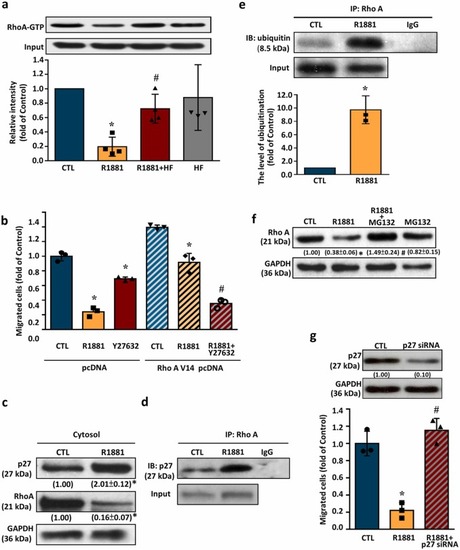
Reduction of the RhoA activity contributes to the R1881-reduced endothelial cell migration. (a) Treatment with R1881 (5 nM) for 6 h reduced the RhoA activity in HUVECs, and this effect was abolished by pre-treatment with HF (5 nM). Top panel: a representative result of the level of RhoA-GTP in HUVECs. Bottom panel: quantitative results of RhoA-GTP after adjust with their own input. Values present the means of fold of corresponding control ± s.e.mean. (n = 4). *p < 0.05 different from corresponding control. #p < 0.05 different from the R1881-treated group. (b). Transfection with RhoA V14 pcDNA prevented the R1881-induced migration inhibition in HUVECs, and this prevention effect was abolished by pre-treatment with Y27632, a ROCK inhibitor. Values present the means of fold of corresponding control ± s.e.mean. (n = 3). *p < 0.05 different from corresponding control. #p < 0.05 different from the R1881-treated group. (c) Treatment with R1881 (5 nM) for 6 h increased the level of cytosolic p27 protein, but reduced the level of cytosolic RhoA protein in HUVECs. Values shown in parentheses represent the quantified results after adjusted with their own GAPDH protein levels and expressed as fold of control. (n = 3). (d) Treatment with R1881 (5 nM) for 6 h increased the formation of RhoA-p27 complex in HUVECs. (e) Co-immunoprecipitation analysis demonstrated that treatment with R1881 (5 nM) for 6 h increased the RhoA ubiquitination in HUVECs. Values present the means of fold of corresponding control ± s.e.mean. (n = 3). *p < 0.05 different from the DMSO-treated group. (f) Treatment with R1881 (5 nM) for 6 h reduced the level of RhoA protein, and this reduction was abolished by pre-treatment with MG132, a proteasome inhibitor. Values shown in parentheses represent the quantitative results after adjusted with their own GAPDH protein levels and expressed as fold of control. (n = 3). (g) Transfection with p27 siRNA, which knocked-down p27 expression (top panel), abolished the R1881-induced migration inhibition in HUVECs. Values present the means of fold of corresponding control ± s.e.mean. (n = 4). *p < 0.05 different from the DMSO-treated group. #p < 0.05 different from the R1881-treated group. HF, hydroxyflutamide; R1881, metribolone. |
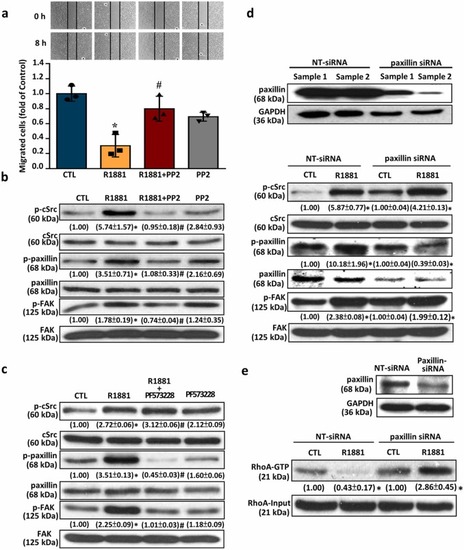
cSrc-mediated signaling pathway is involved in the R1881-induced migration inhibition in HUVECs. (a) Treatment with R1881 (5 nM) 8 h reduced the migration in HUVECs, and this effect was abolished by pre-treatment with 100 nM of PP2, (a cSrc inhibitor). (b) Treatment with R1881 (5 nM) for 2 min increased the levels of p-cSrc, p-paxillin and p-FAK in HUVECs, and these effects were abolished by pre-treatment with 100 nM of PP2. (c) Treatment with R1881 (5 nM) for 5 min increased the levels of p-cSrc, p-paxillin and p-FAK in HUVECs. Pre-treatment with 4 nM of PF573228 (a FAK inhibitor) abolished the R1881-increased the levels of p-FAK and p-paxillin, but not p-cSrc, in HUVECs. (d) Treatment with R1881 (5 nM) for 5 min increased the levels of p-cSrc, p-paxillin and p-FAK in HUVECs. Transfection with paxillin siRNA, which knocked-down the expression of paxillin (top panel), abolished the R1881-increased the levels of p-paxillin, but not p-cSrc and p-FAK, in HUVECs. (e) Treatment with R1881 (5 nM) for 5 min significantly reduced the levels of Rho-GTP in HUVECs. Transfection with paxillin siRNA, which knocked-down paxillin expression (top panel), abolished the R1881-reduced RhoA activity in HUVECs. Values shown in parentheses represent the quantitative results after adjusted with their own input levels and expressed as fold of their own control. (n = 3). *p < 0.05 different from corresponding control. #p < 0.05 different from the R1881-treated group. siRNA, NT-siRNA, non-target siRNA; small interfering RNA. |
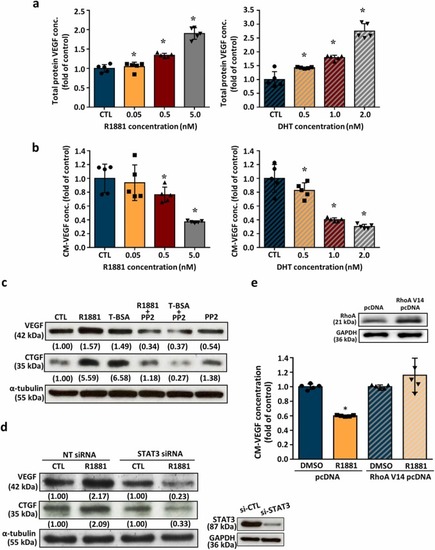
AR activation increases the intracellular VEGF levels, but reduces VEGF secretion. Treatment with R1881 (left panel) or DHT (right panel) for 24 h concentration-dependently increased the levels of VEGF protein in HUVECs (a), but reduced the VEGF concentrations in the conditioned medium of HUVECs culture (b). The concentrations of VEGF in HUVECs and conditioned medium were measured by ELISA analyses and expressed as fold of control. Values represent the means± s.e.mean. (n = 4). *p < 0.05 different from control (without R1881 treatment). (c) Treatment with R1881 (5 nM) or T-BSA (20 nM) for 24 h increased the levels of VEGF and CTGF in HUVECs, and these effects were abolished by pre-treatment with 100 nM of PP2, a cSrc inhibitor. Values (means± s.e.mean.) shown in parentheses represent the quantitative results after adjusted with the α-tubulin protein levels and expressed as fold of control. (n = 3). *p < 0.05 different from corresponding control. #p < 0.05 different from R1881-treated group. §p < 0.05 different from T-BSA-treated group. (d) Treatment with R1881 (5 nM) for 24 h increased the levels of VEGF and CTGF protein in HUVECs, and these effects were abolished by knockdown of STAT3 expression. Values shown in parentheses represent the quantitative results after adjusted with the α-tubulin protein levels and expressed as fold of corresponding control. Values represent the means± s.e.mean. (n = 3). *p < 0.05 different from corresponding control. #p < 0.05 different from NT siRNA+R1881. (e) Treatment of HUVECs with R1881 (5 nM) for 24 h decreased the level of VEGF protein in conditioned medium, and these effects were abolished by transfection with RhoA V14 pcDNA, which increased the level of RhoA protein. Values represent the means± s.e.mean. (n =3). *p < 0.05 different from the DMSO-treated group. CM, conditioned medium; T-BSA, testosterone-bovine serum albumin. |
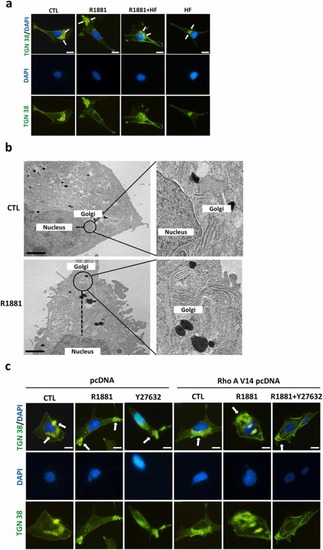
Rho A inactivation contributes to the R1881-induced Golgi body reorientation in HUVECs. (a) Treatment with R1881 (5 nM) for 6 h induced the Golgi apparatus to move away from the nucleus, and this effect was abolished by pre-treatment with HF (5 nM). The cells were fixed with methanol, and then labeled with an anti-TGN 38 antibody followed by a FITC-conjugated secondary antibody. The nuclei were visualized with DAPI staining. The TGN 38 positive immunoreactivity (green color), which is a Golgi apparatus marker, was indicated by the arrow. Bar = 25 μm. (b) The transmission electron microscope (TEM) images track the location of the Golgi apparatus in control (top panel) and R1881-treated HUVECs (bottom panel). Bar = 10 μm. (c) Treatment with R1881 (5 nM) for 6 h caused the Golgi apparatus to move away from the nucleus in HUVECs, and this effect was abolished by transfection with RhoA V14 pcDNA. However, this prevention effect induced by RhoA V14 pcDNA transfection was abolished by pre-treatment with Y27632, a ROCK inhibitor. The cells were fixed with methanol, and then labeled with an anti-TGN 38 antibody followed by a FITC-conjugated secondary antibody. The nuclei were visualized with DAPI staining. The TGN 38 positive immunoreactivity (green color) was indicated by the arrow. Bar = 25 μm. |
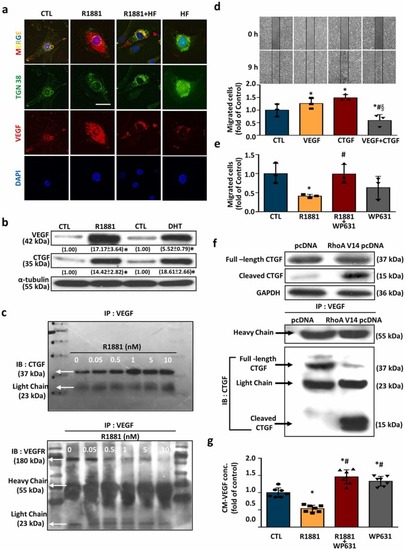
CTGF participates in the R1881-induced VEGF accumulation in the cytosol, subsequently inhibiting cell migration. (a) Double-exposed immunofluorescence micrographs showcasing TGN 38 (a Golgi apparatus marker) in green and VEGF in red. In DMSO-treated control cells, VEGF-positive immunoreactivity is observed to co-localize with TGN 38-positive areas. Nuclei are highlighted by DAPI staining in blue. Scale bar = 20 μm. (b) Both R1881 (5 nM) and DHT (2 nM) increased the levels of VEGF and CTGF protein in HUVECs. Values shown in parentheses represent the quantitative results after adjusted with their own α-tubulin protein levels and expressed as fold of their own control. (n = 3). *p < 0.05 different from corresponding control. (c) R1881 (0.05–10 nM) concentration-dependently increased the formation of VEGF-CTGF complex (top panel) and decreased the formation of VEGF-VEGFR complex in HUVECs (bottom panel). (d) Treatment with VEGF (100 ng/mL) or CTGF (10 μM) alone for 8 h enhanced the endothelial cell migration, and these effects disappeared when the cells were co-treated with VEGF and CTGF together. Values present the means of fold of corresponding control ± s.e.mean. (n = 3). *p < 0.05 different from corresponding control. #p < 0.05 different from the VEGF-treated group. §p < 0.05 different from the CTGF-treated group. (e) Treatment with R1881 for 8 h reduced the endothelial cell migration, and this effect was abolished by pre-treatment with WP631, a CTGF inhibitor. Values present the means of fold of corresponding control ± s.e.mean. (n = 3). *p < 0.05 different from corresponding control. #p < 0.05 different from the R1881-treated group. CTGF, connective tissue growth factor; IB, immunoblotting; IP, immunoprecipitation; VEGF, vascular endothelial growth factor. (f) RhoA prevents the CTGF-reduced VEGF secretion in HUVECs. Transfection with RhoA V14 pcDNA increased the cleavage of CTGF and the complex formation of VEGF-CTGF (cleaved form), but reduced the complex formation of VEGF-CTGF (full length) in HUVECs. (g) Pre-treatment with WP631, a CTGF inhibitor, abolished the R1881-reduced the VEGF concentrations in the conditioned medium of HUVECs culture. Values present the means of fold of corresponding control ± s.e.mean. (n = 4). *p < 0.05 different from corresponding control. #p < 0.05 different from the R1881-treated group. Conc. concentration; IB, immunoblot; IP, immunoprecipitation;. |
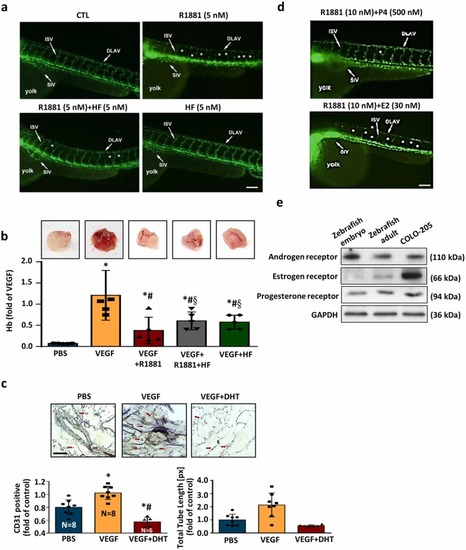
R1881 attenuates angiogenesis and modulates the impact of female sex hormones on R1881-induced anti-angiogenic responses. (a) Zebrafish angiogenesis model was conducted to evaluate the effect of R1881 on angiogenesis. Treatment with R1881 for 72 h after post-fertilization caused failure in forming the ISV and the DLAV in embryos. However, co-treatment with HF abolished the R1881-induced interruption of angiogenesis. Fluorescent images show defective vasculatures in ISV and DLAV at the R1881-treated Tg(fli1:EGFP)y1 embryos. The white arrowheads indicate the failure of forming the ISV or DLAV in the R1881-treated Tg(fli1:EGFP)y1 embryos. Bar = 100 μm. (b) The effect of R1881 on angiogenesis was evaluated using matrigel plug assay as described in the Materials and Methods section. Treatment with VEGF (200 ng/mL) for 14 days increased the level of Hb, an indicator of angiogenesis. Top panel shows the matrigel isolated from the C57BL/6 mouse. Bottom panel shows the quantitative results of Hb. (c) DHT (5 nM) reduced the VEGF-increased angiogenesis. The matrigel plug isolated from the mouse was cut into 5 μm sections and stained with an anti-CD31 antibody. The arrowheads indicate the positive CD31 immunoreactivity (endothelial cell marker). Bar = 100 μm. Top panel shows a representative section stained with an anti-CD31 antibody. Bottom panel shows the quantitative results of CD31 positive cell number. (n = 5). Values present the means of fold of corresponding control ± s.e.mean. (n = 4). *p < 0.05 different from PBS group (control). #p < 0.05 different from the VEGF-treated group. §p < 0.05 different from the VEGF+R1881-treated group. DLAV, dorsal longitudinal anastomotic vessels; Hb, hemoglobin; ISV, intersegmental vessels. (d) Treatment with R1881 at 20 h after post-fertilization significantly inhibited angiogenesis and this inhibition was suppressed by co-treatment with HF (5 nM). Co-treatment with P4 (500 nM), but not E2 (30 nM), prevented the R1881-induced anti-angiogenesis. Embryos were examined at 2 days post-fertilization. More than 20 embryos were examined in each experimental group. Twenty dechorionated Tg(flil:EGFP)y1 embryos were grown in a 24-well plate, and incubated in 2 mL solution containing R1881 (10 nM). Fluorescent images show defective vasculatures in ISV (arrowheads) and DLAV (arrows) at the R1881-treated Tg(flil:EGFP)y1 embryos. The stars indicate the failure of forming the ISV and DLAV in the R1881-treated Tg(flil:EGFP)y1 embryos. Bar = 100 μm. (e) The expressions of AR, PR and ER were detected in the adult zebrafish at age of older than 1 year, but only AR and PR were detected in zebrafish embryos at 20 h post-fertilization. AR, androgen receptor; CTL, control; DLAV, dorsal longitudinal anastomotic vessels; ER, estrogen receptor; ISV, intersegmental vessels; NC, notochord; PR, progesterone receptor. |