
- Title
-
Lowered GnT-I Activity Decreases Complex-Type N-Glycan Amounts and Results in an Aberrant Primary Motor Neuron Structure in the Spinal Cord
- Authors
- Hatchett, C.J., Hall, M.K., Messer, A.R., Schwalbe, R.A.
- Source
- Full text @ J Dev Biol
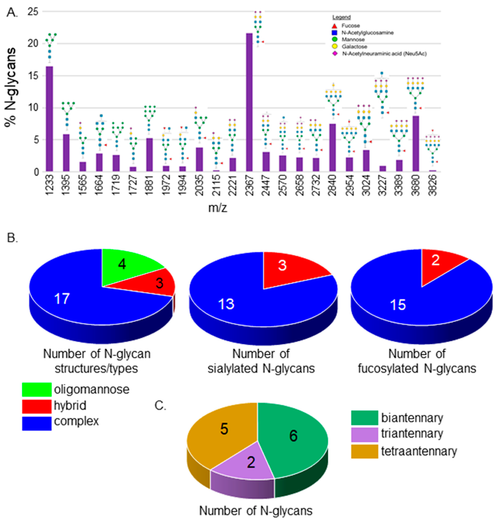
MALDI-TOF MS profiles of the N-glycans derived from Wt AB spinal cords. MALDI-TOF MS spectra of released N-glycan structures (%) from Wt AB spinal cords (A). The relative abundance is the average of four separate runs. N-Glycan numbers correlate to Supplementary Tables S1 and S2. Pie charts denote the number of N-glycan structures per type, and the number of sialylated and fucosylated hybrid and complex N-glycan structures (B). The breakdown of complex-type N-glycan structures by the number of antennae (C). |
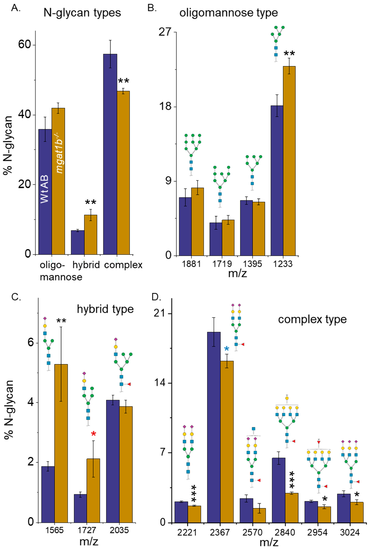
Comparison of N-glycan structures derived from adult Wt AB and mgat1b−/− mutant zebrafish. Averaged MS spectra of released N-glycan types (%) from Wt AB (purple bars) and mgat1b−/− (gold bars) zebrafish (A). Representative bar graphs showing the percents of oligomannose (B), hybrid (C), and complex (D) structures with the corresponding m/z value of the structures. Data are presented as mean ± SEM, n = 4, where n signifies the number of technical replicates, and Wt AB to mutant zebrafish were compared using Student’s t-test (* p < 0.11, * p < 0.08, ** p < 0.05, *** p < 0.01). PHENOTYPE:
|
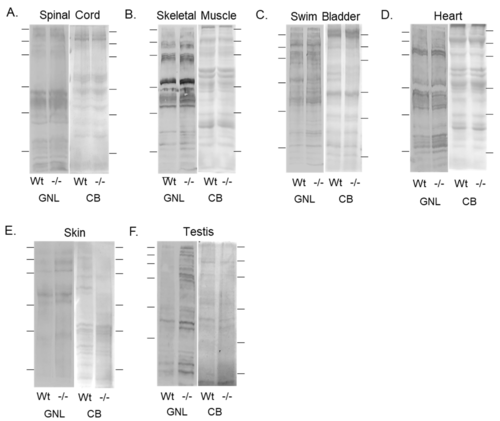
Validation of diminished mgat1b expression and a concomitant increase in oligomannose N-glycans in various tissues. Lectin blots of total membranes from spinal cords (A), skeletal muscles (B), swim bladders (C), hearts (D), and whole cell lysates of skin (E), and testis (F) harvested from adult Wt AB and mgat1b−/− mutant zebrafish. Separated proteins were probed with Galanthus nivalis lectin (GNL). In all cases, lectin blots were reproducible (n = 3); see Figure S1. For the quantification of lectin band intensities relative to protein loads, see Table S3. Coomassie blue (CB)-stained gel adjacent to each lectin demonstrated equal protein loads among the samples. Lines adjacent to the blots denote protein markers (in kDa) 250, 150, 100, 75, 50, and 37. PHENOTYPE:
|
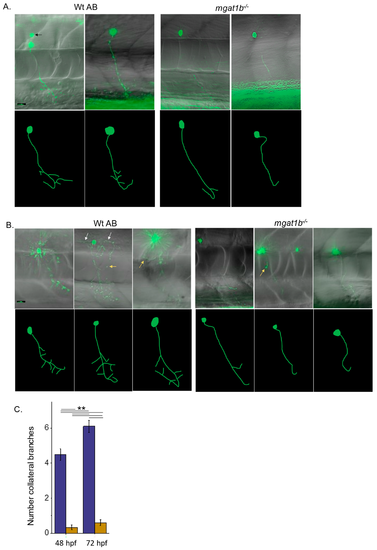
Mutant fish show maldeveloped primary motor neurons in the spinal cord relative to Wt AB fish. EGFP-expressing CaP primary motor neuron images captured at 48–52 hpf (A) and 72–76 hpf (B) using a 40X objective. Upper panels depict images captured, overlaid with bright field images. Black arrows denote secondary, white arrows signify middle primary (MiP), and yellow arrows show rostral primary (RoP) motor neurons. For clarity, the lower panels are tracings of CaP neurons from reconstructed images. The tracings do not include MiP, RoP, or secondary neurons. Scale bar represents 25 µm in all cases. Assessment of the number of collateral branches in Wt AB (purple) and mgat1b−/− (gold bars) fish (C). Wt AB (n = 20); mgat1b−/− (n = 22); n denotes a neuron. Data are presented as mean ± SEM and were compared using one-way ANOVA at p < 0.01, **. PHENOTYPE:
|
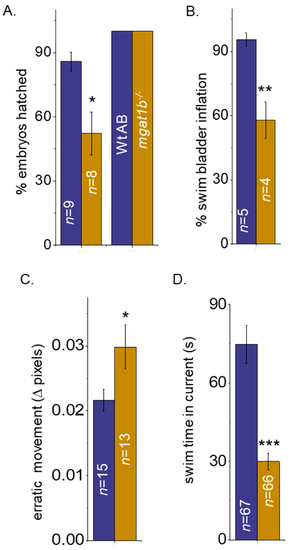
Mutant fish demonstrate delayed hatching and swim bladder development, and motor skill impairment. Bar graphs representing the percent (%) of embryos hatched at 72 hpf (left bars) and 78 hpf (right bars), while n denotes number of clutches (A), and the percent of swim bladders inflated at 5 dpf, while n signifies number of clutches (B). Movement in pixels acquired via the mean square difference (MSD) assay at 8 dpf, while n denotes the number of fish (C). Time in seconds that adult zebrafish could efficiently swim without being swept into the whirlpool as observed in the spinner task assay, n represents the number of fish (D). In all cases, Wt AB are shown in purple bars, and Mgat1b−/− in gold bars. Data are presented as mean ± SEM and were compared using Student’s t-test (*** p < 0.0001; ** p < 0.01; * p < 0.04). PHENOTYPE:
|