
FIGURE
Fig. 1
- ID
- ZDB-FIG-240829-42
- Publication
- Hatchett et al., 2024 - Lowered GnT-I Activity Decreases Complex-Type N-Glycan Amounts and Results in an Aberrant Primary Motor Neuron Structure in the Spinal Cord
- Other Figures
- All Figure Page
- Back to All Figure Page
Fig. 1
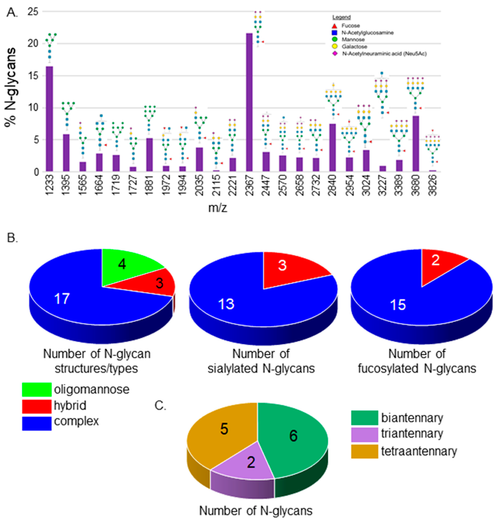
MALDI-TOF MS profiles of the N-glycans derived from Wt AB spinal cords. MALDI-TOF MS spectra of released N-glycan structures (%) from Wt AB spinal cords (A). The relative abundance is the average of four separate runs. N-Glycan numbers correlate to Supplementary Tables S1 and S2. Pie charts denote the number of N-glycan structures per type, and the number of sialylated and fucosylated hybrid and complex N-glycan structures (B). The breakdown of complex-type N-glycan structures by the number of antennae (C). |
Expression Data
Expression Detail
Antibody Labeling
Phenotype Data
Phenotype Detail
Acknowledgments
This image is the copyrighted work of the attributed author or publisher, and
ZFIN has permission only to display this image to its users.
Additional permissions should be obtained from the applicable author or publisher of the image.
Full text @ J Dev Biol