
Fig. 3
- ID
- ZDB-IMAGE-240829-44
- Publication
- Hatchett et al., 2024 - Lowered GnT-I Activity Decreases Complex-Type N-Glycan Amounts and Results in an Aberrant Primary Motor Neuron Structure in the Spinal Cord
- All Figures
- Figures for Hatchett et al., 2024
|
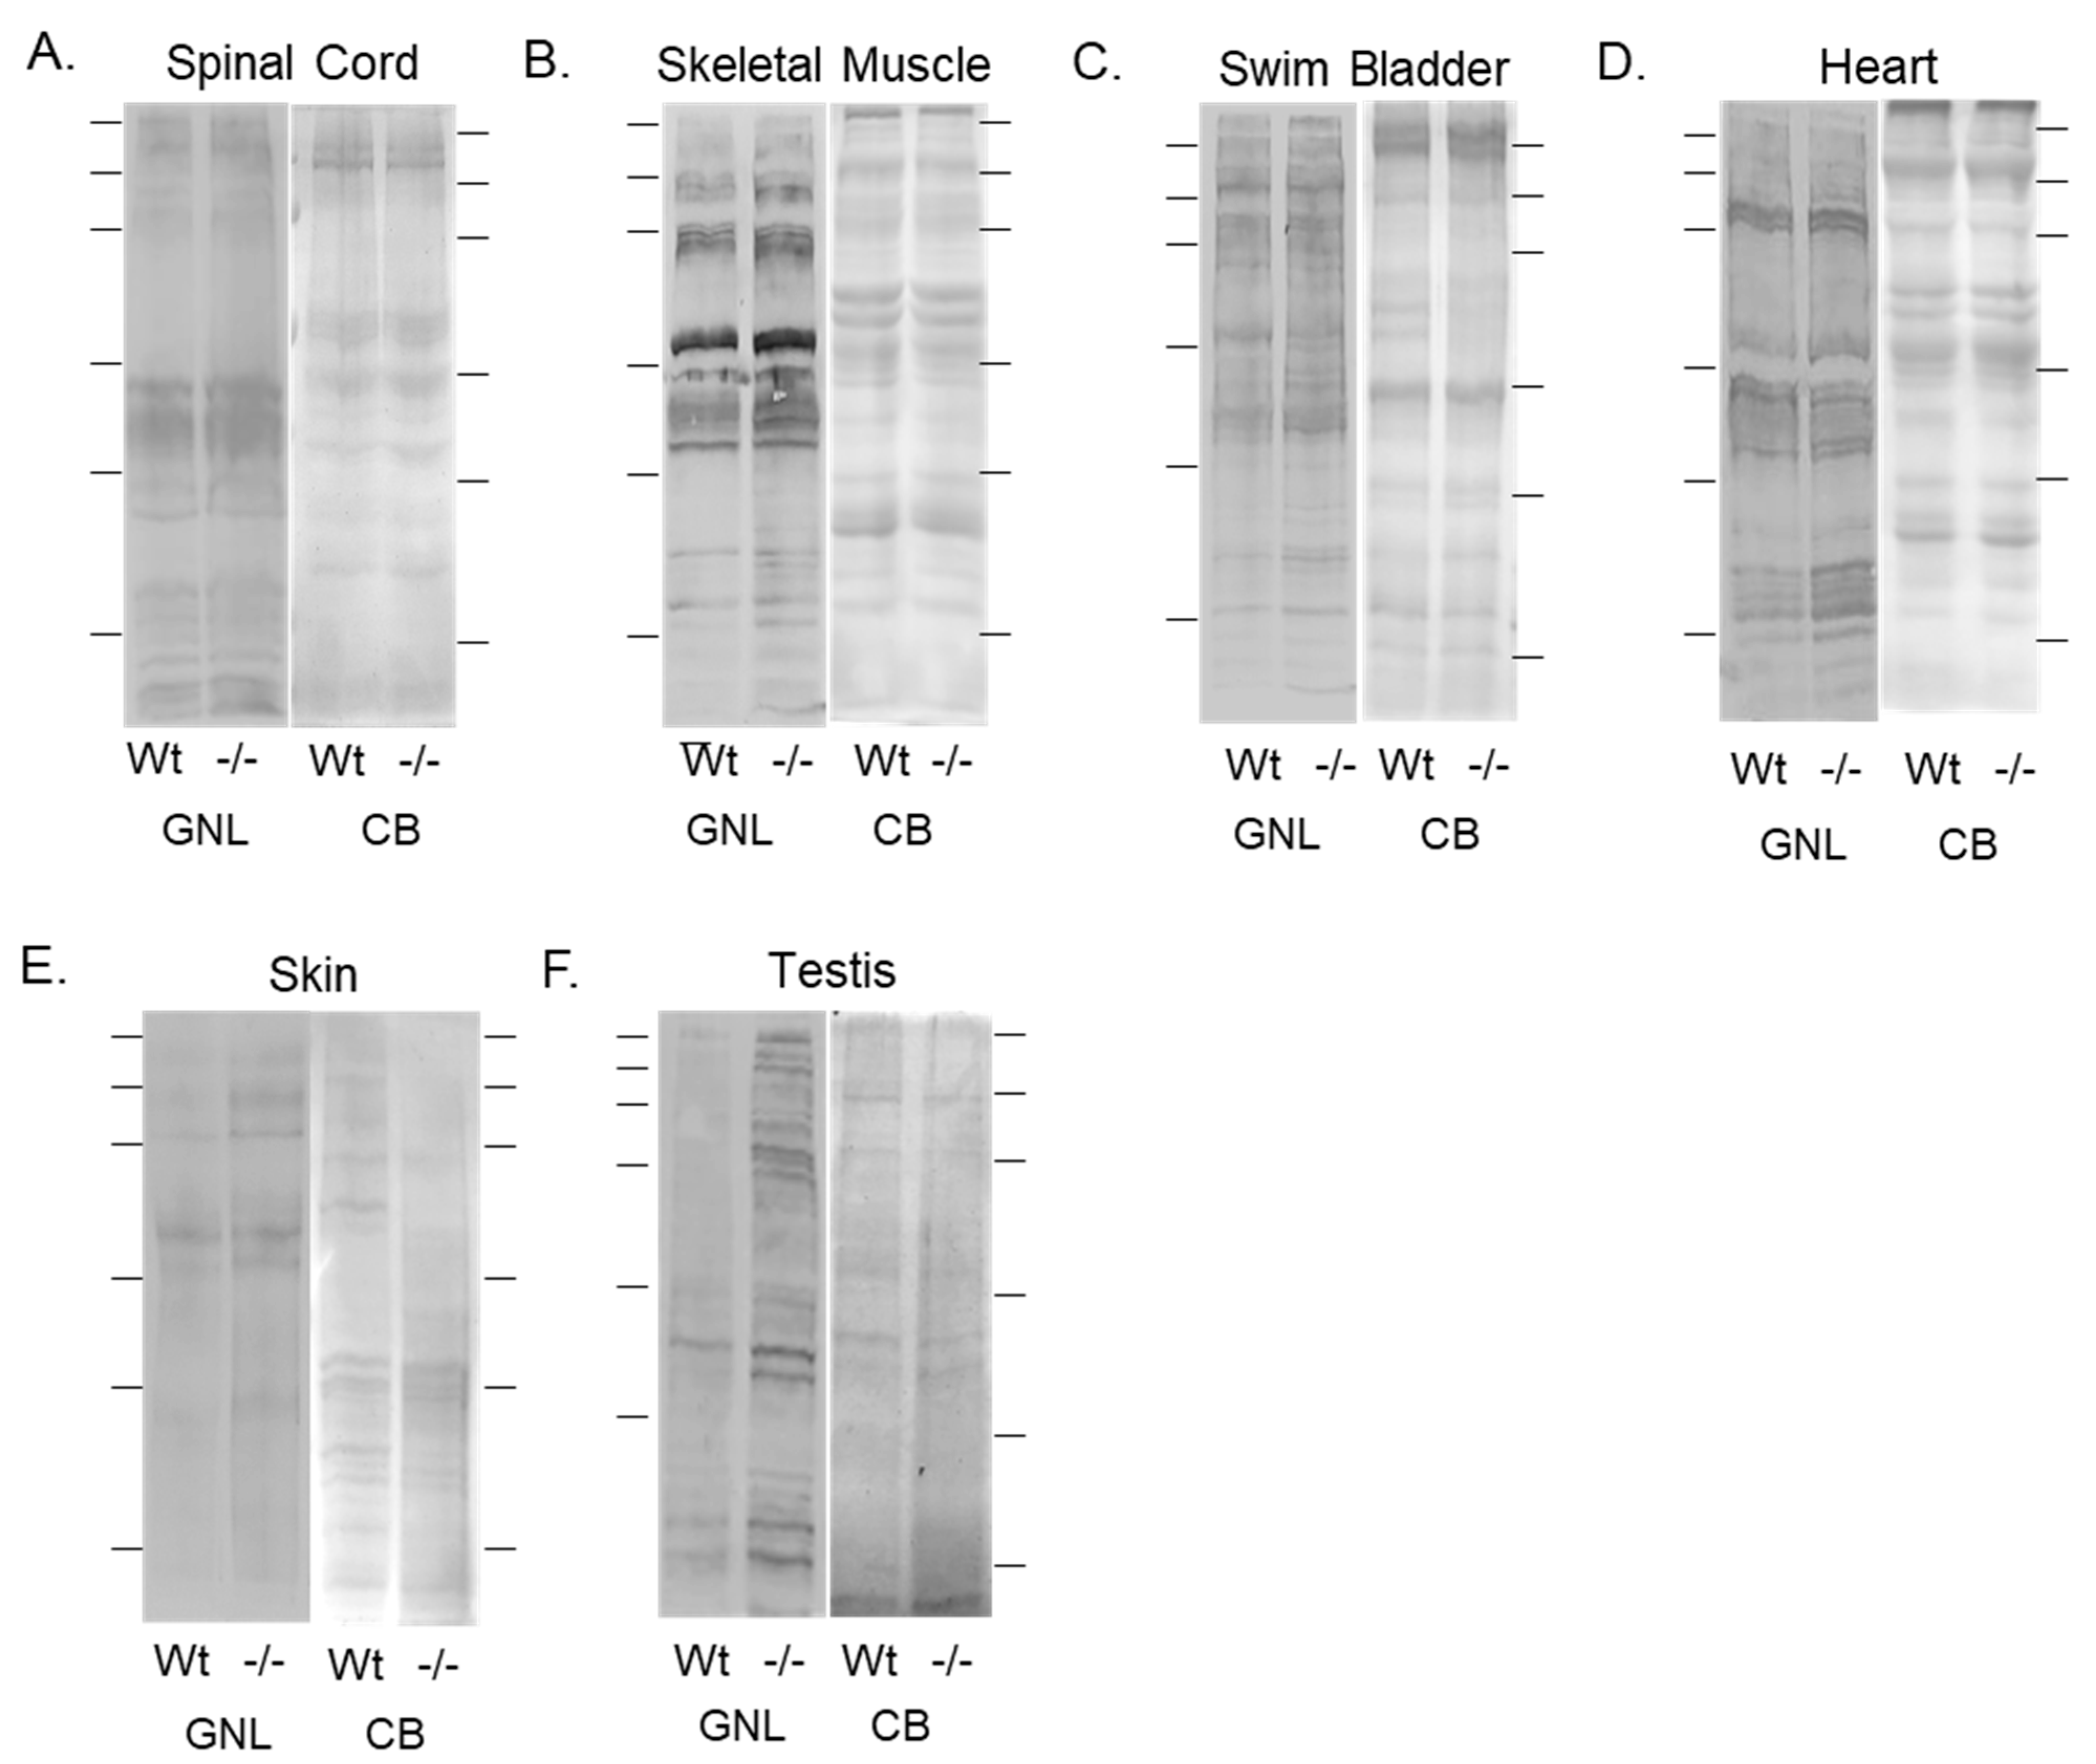
Fig. 3 Validation of diminished mgat1b expression and a concomitant increase in oligomannose N-glycans in various tissues. Lectin blots of total membranes from spinal cords (A), skeletal muscles (B), swim bladders (C), hearts (D), and whole cell lysates of skin (E), and testis (F) harvested from adult Wt AB and mgat1b−/− mutant zebrafish. Separated proteins were probed with Galanthus nivalis lectin (GNL). In all cases, lectin blots were reproducible (n = 3); see Figure S1. For the quantification of lectin band intensities relative to protein loads, see Table S3. Coomassie blue (CB)-stained gel adjacent to each lectin demonstrated equal protein loads among the samples. Lines adjacent to the blots denote protein markers (in kDa) 250, 150, 100, 75, 50, and 37.