
Fig. 4
- ID
- ZDB-IMAGE-240829-45
- Publication
- Hatchett et al., 2024 - Lowered GnT-I Activity Decreases Complex-Type N-Glycan Amounts and Results in an Aberrant Primary Motor Neuron Structure in the Spinal Cord
- All Figures
- Figures for Hatchett et al., 2024
|
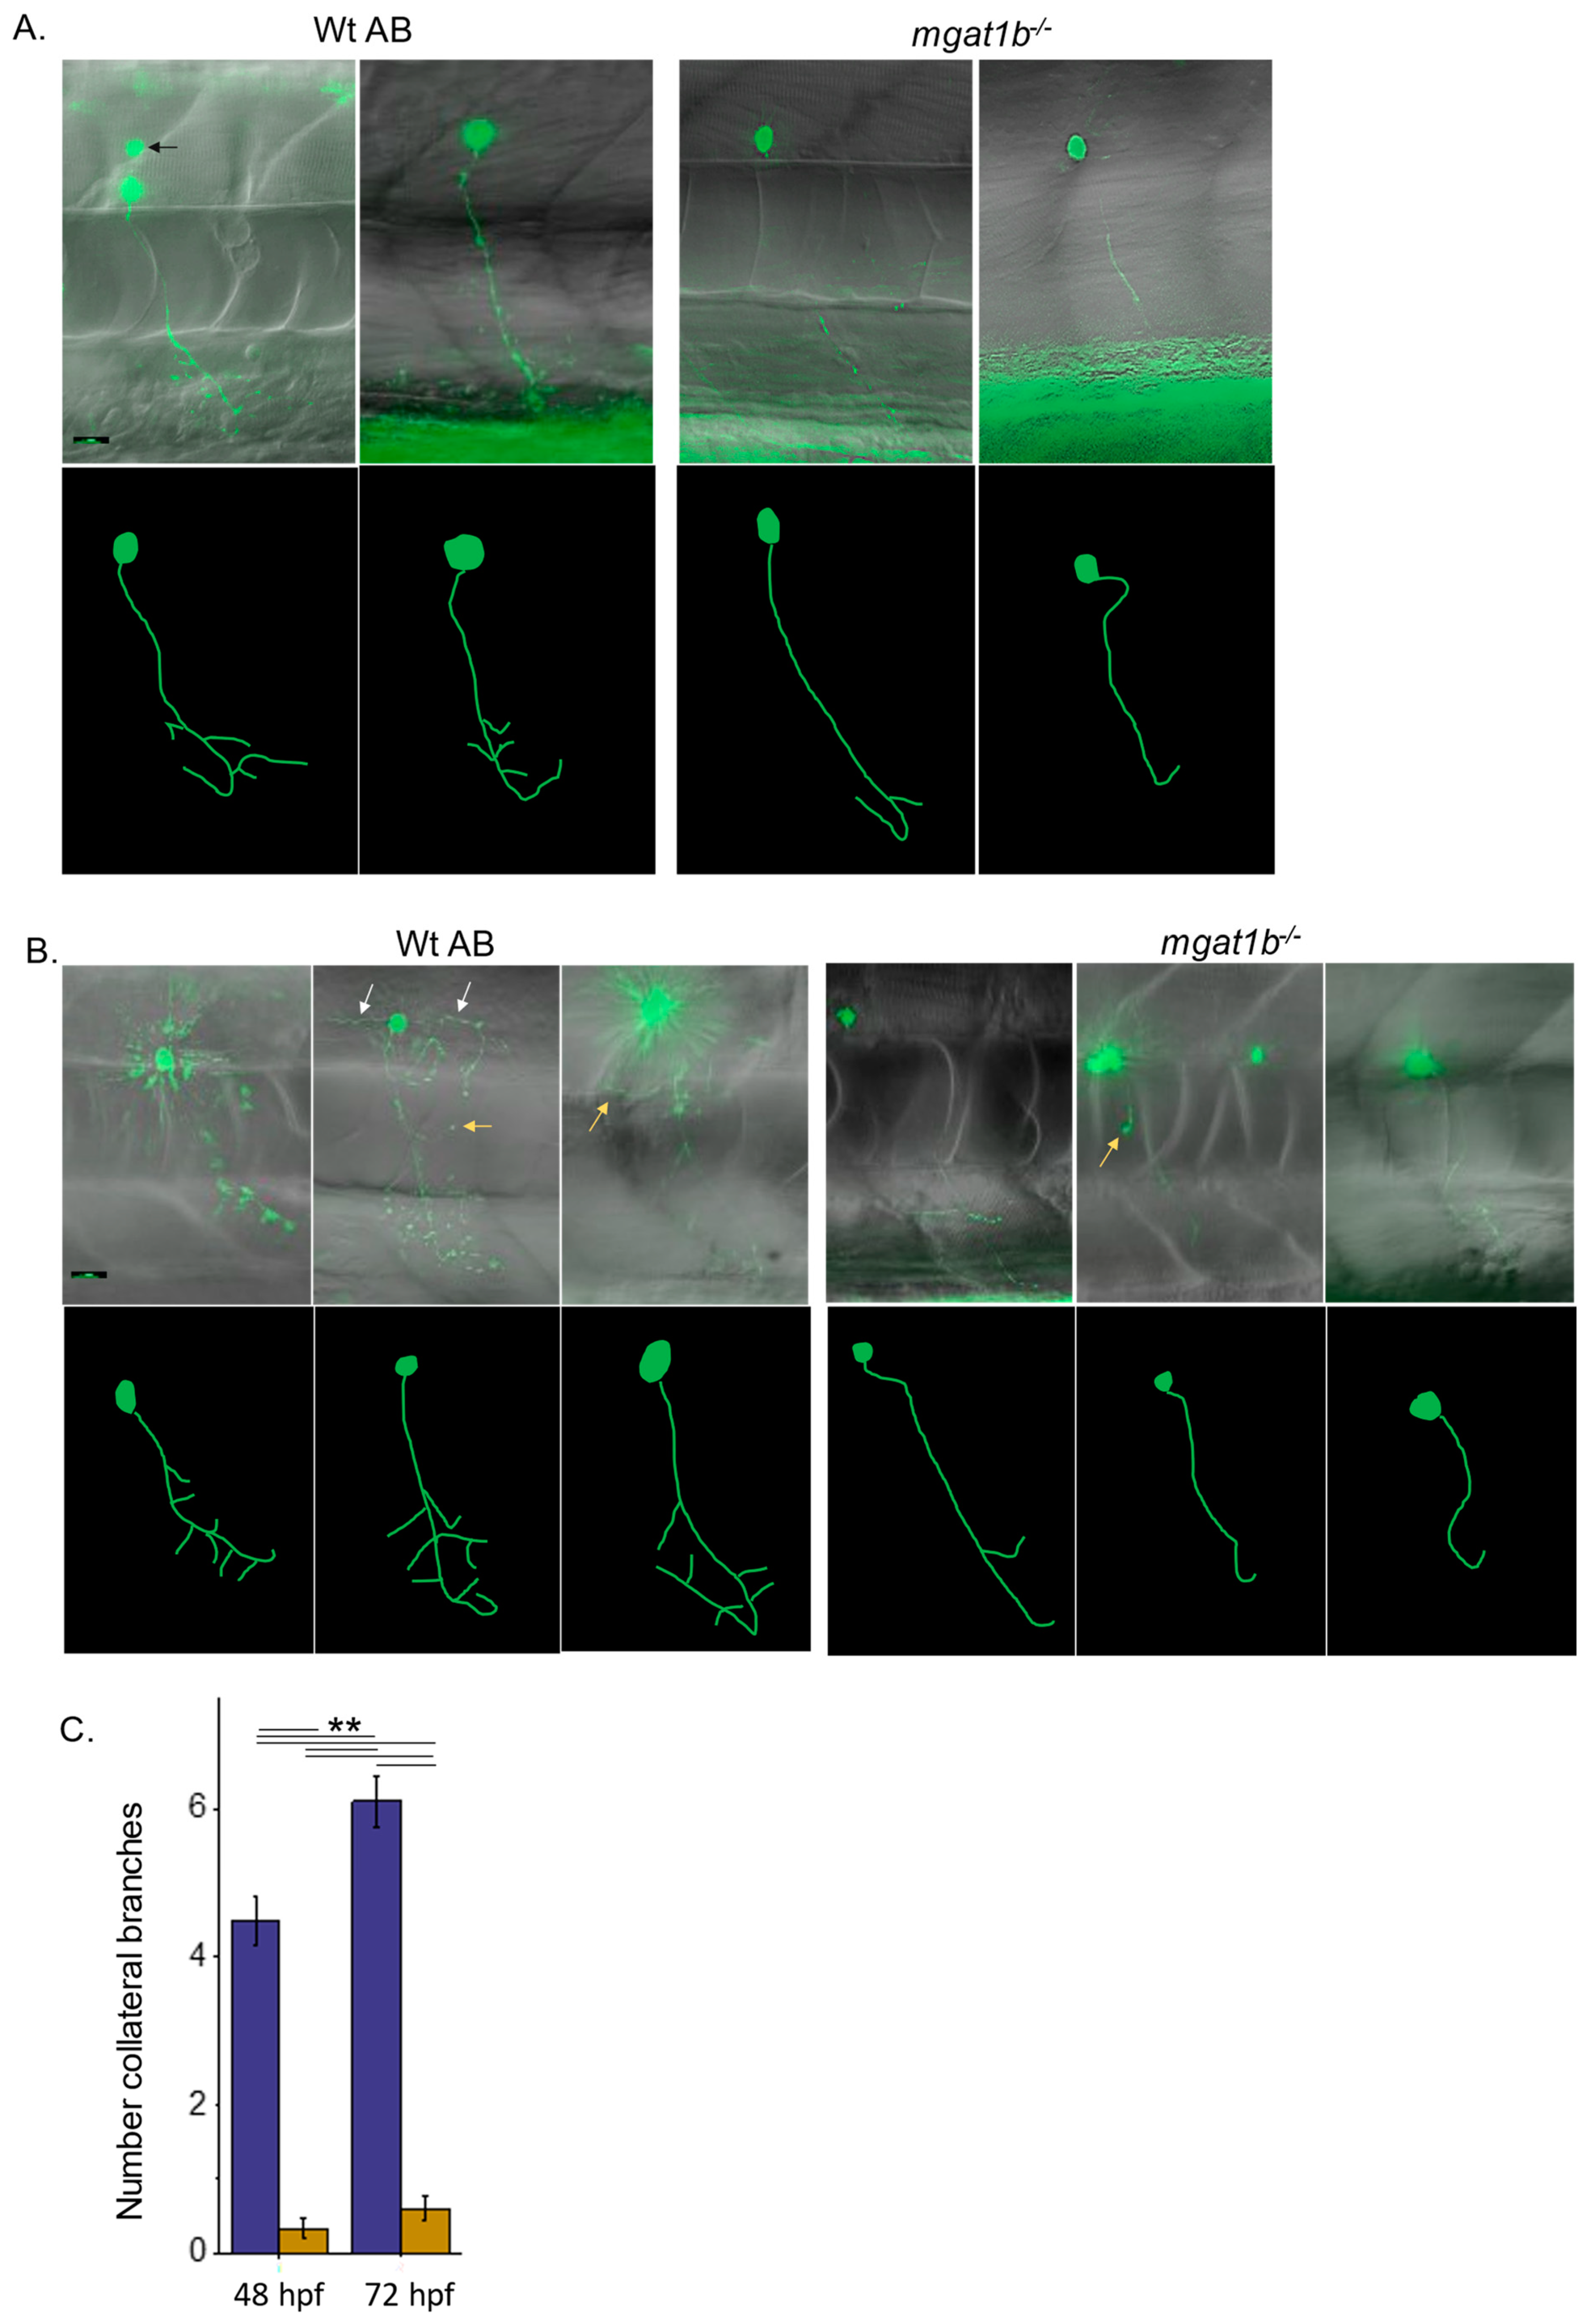
Fig. 4 Mutant fish show maldeveloped primary motor neurons in the spinal cord relative to Wt AB fish. EGFP-expressing CaP primary motor neuron images captured at 48–52 hpf (A) and 72–76 hpf (B) using a 40X objective. Upper panels depict images captured, overlaid with bright field images. Black arrows denote secondary, white arrows signify middle primary (MiP), and yellow arrows show rostral primary (RoP) motor neurons. For clarity, the lower panels are tracings of CaP neurons from reconstructed images. The tracings do not include MiP, RoP, or secondary neurons. Scale bar represents 25 µm in all cases. Assessment of the number of collateral branches in Wt AB (purple) and mgat1b−/− (gold bars) fish (C). Wt AB (n = 20); mgat1b−/− (n = 22); n denotes a neuron. Data are presented as mean ± SEM and were compared using one-way ANOVA at p < 0.01, **.