
- Title
-
In vitro study of ATP1A3 p.Ala275Pro mutant causing alternating hemiplegia of childhood and rapid-onset dystonia-parkinsonism
- Authors
- Ruan, D.D., Zou, J., Liao, L.S., Ji, M.D., Wang, R.L., Zhang, J.H., Zhang, L., Gao, M.Z., Chen, Q., Yu, H.P., Wei, W., Li, Y.F., Li, H., Lin, F., Luo, J.W., Lin, X.F.
- Source
- Full text @ Front. Neurosci.
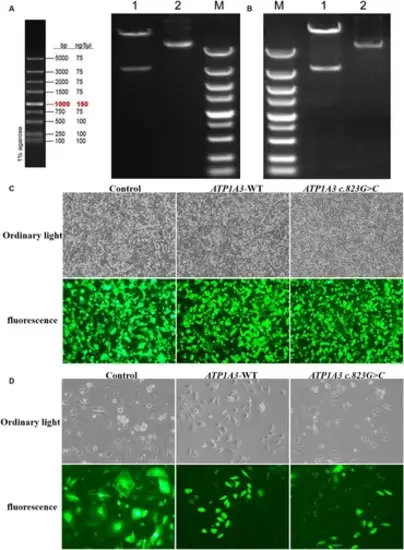
Plasmid construction and cell culture growth. (A) The left graph shows the schematic diagram of the marker, and the right graph shows the electropherogram of ATP1A3 wild type cloned plasmid digested with XbaI/NotI. Lane 1 is plasmid digested by XbaI-NotI, Lane 2 is plasmid DNA, and Lane M is DNA marker. (B) Electropherogram of ATP1A3 (p.Ala275Pro) cloned plasmid digested with XbaI/NotI. Lane 1 is plasmid digested by XbaI-NotI, Lane 2 is plasmid DNA, and Lane M is DNA marker. (C) Green fluorescent protein expression after transfection of cells carrying unloaded (control), wild-type (ATP1A3-WT), and ATP1A3 c.823G > C mutant, suggesting that there was no significant difference in transfection efficiency between the groups. (D) Cell fluorescence of stable cell lines carrying control, ATP1A3-WT, and ATP1A3 c.823G > C mutant. |
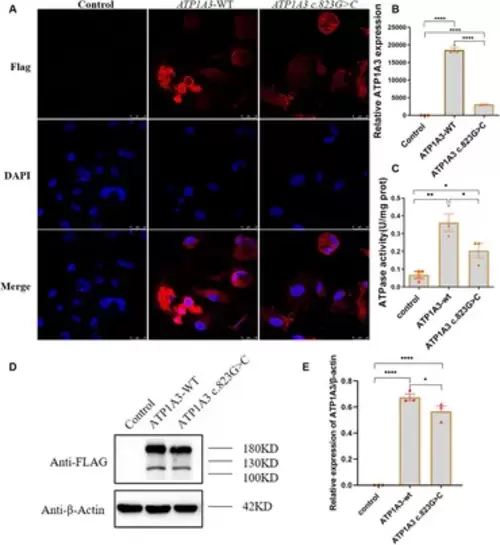
Effect of the c.823G > C mutation on ATP1A3 gene expression and Na+/K+-ATPase activity in cells. (A) Immunofluorescence detection of ATP1A3 protein expression and localization in cells carrying the unloaded (control), wild-type (ATP1A3-WT), and ATP1A3 c.823G > C mutants. ATP1A3 protein was mainly distributed in the cytoplasm, and the expression of ATP1A3 protein was weaker in cells after the c.823G > C mutation compared with the ATP1A3-WT group, but the localization of ATP1A3 protein after the mutation was not significantly different from that of the ATP1A3-WT group. (B) RT-qPCR showed that the mRNA level of ATP1A3 in cells after c.823G > C mutation was significantly lower than that in the ATP1A3-WT group. (C) The Na+/K+-ATPase activity was up-regulated in the cells of both ATP1A3-WT and ATP1A3 c.823G > C groups compared to the control group, but the Na+/K+-ATPase activity was decreased in the cells after the c.823G > C mutation compared to the ATP1A3-WT group. (D) Using an anti-Flag antibody against Flag-tagged ATP1A3 protein, the expression of Flag-ATP1A3 protein in cell lysates of control, ATP1A3-WT, and ATP1A3 c.823G > C groups was detected by western blot (WB). The WB quantification data are shown in (E). Data are presented as mean ± SEM, N = 3; NS, not significant, *p < 0.05, **p < 0.01, ***p < 0.001, and ****p < 0.0001. |
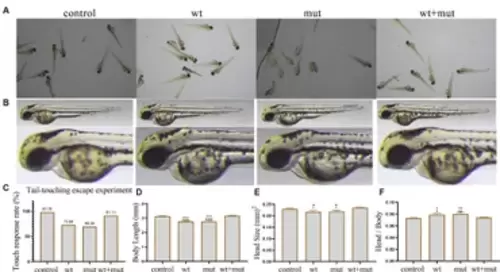
Effects of ATP1A3 gene on tail-touch escape ability and growth and development of zebrafish. (A) Representative images of zebrafish touch-tail escape experiments at 48 hpf in control, wild-type ATP1A3 overexpression (wt), ATP1A3 c.823G > C mutation overexpression (mut), and rescue (wt + mut) groups. (B) Representative images of the brain and overall morphology of zebrafish in control, wt, mut, and wt + mut groups photographed in white light at 48 hpf. (C–F) Statistical graphs of touch-tail escape experiments, body length, brain size, and brain size/body length data for zebrafish in control, wt, mut, and wt + mut groups. *p < 0.05, **p < 0.01, ***p < 0.001, and ****p < 0.0001 vs. the control group. ▲p < 0.05, ▲▲p < 0.01, ▲▲▲p < 0.001, and ▲▲▲▲p < 0.0001 vs. the wt + mut group. |
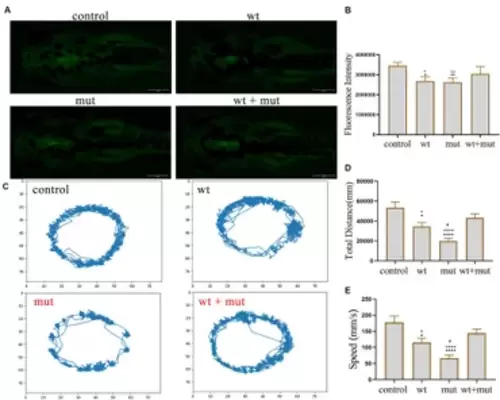
Effects of ATP1A3 gene on dopamine neuron development and behavioral trajectory of zebrafish. (A) Representative graphs of dopamine neuron fluorescence in the brain of zebrafish at 72 hpf in control, wild-type ATP1A3 overexpression (wt), ATP1A3 c.823G > C mutation overexpression (mut), and rescue (wt + mut) groups. (B) Statistical graphs of the dopamine neuron fluorescence area in the brain of zebrafish in control, wt, mut, and wt + mut groups. (C) Representative graphs of the behavioral trajectories of each group of zebrafish as they developed to 120 hpf. (D,E) Statistical graphs of the data on the swimming distance and average swimming speed of zebrafish in each group. *p < 0.05, **p < 0.01, ***p < 0.001, and ****p < 0.0001 vs. the control group. ▲p < 0.05, ▲▲p < 0.01, ▲▲▲p < 0.001, and ▲▲▲▲p < 0.0001 vs. the wt + mut group. #p < 0.05 vs. the wt group. |
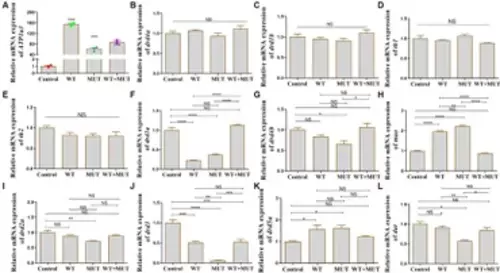
Effect of ATP1A3 gene on dopamine signaling pathway-associated genes in zebrafish. (A) Quantitative analysis of the ATP1A3 gene in zebrafish from control, wild-type ATP1A3 overexpression (WT), ATP1A3 c.823G > C mutation overexpression (MUT), and rescue (WT + MUT) groups when zebrafish development to 24 hpf. The ATP1A3 expression of the experimental and control groups had a significant difference, suggesting that the overexpression model was successfully constructed and subsequent experiments could be carried out. (B–L) Relative mRNA expression of dopamine signaling pathway-associated genes in each group of zebrafish when they developed to 120 hpf. NS, not significant, *p < 0.05, **p < 0.01, ***p < 0.001, and ****p < 0.0001. |
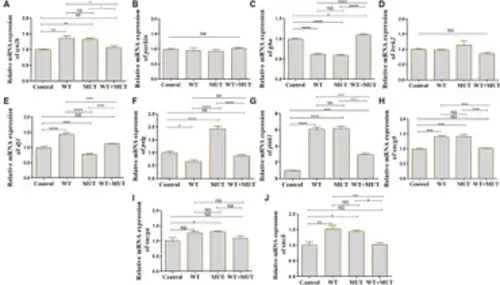
Effects of the ATP1A3 gene on Parkinson’s disease-associated genes in zebrafish. (A-J) Relative mRNA expression of Parkinson’s disease-associated genes in each group of zebrafish when they developed to 120 hpf. WT, wild-type ATP1A3 overexpression group; MUT, ATP1A3 c.823G>C mutation overexpression group; WT+MUT, rescue group. NS, not significant, *p < 0.05, **p < 0.01, ***p < 0.001, and ****p < 0.0001. |
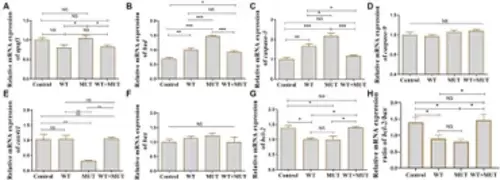
Effects of the ATP1A3 gene on apoptosis-associated genes in zebrafish. (A-H) Relative mRNA expression of apoptosis-associated genes in each group of zebrafish when they developed to 120 hpf. WT, wild-type ATP1A3 overexpression group; MUT, ATP1A3 c.823G>C mutation overexpression group; WT+MUT, rescue group. NS, not significant, *p < 0.05, **p < 0.01, and ***p < 0.001. |