
|
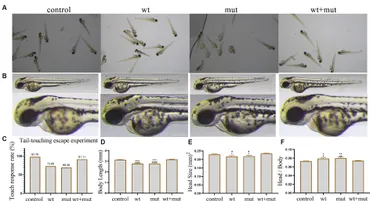
Fig. 3 Effects of ATP1A3 gene on tail-touch escape ability and growth and development of zebrafish. (A) Representative images of zebrafish touch-tail escape experiments at 48 hpf in control, wild-type ATP1A3 overexpression (wt), ATP1A3 c.823G > C mutation overexpression (mut), and rescue (wt + mut) groups. (B) Representative images of the brain and overall morphology of zebrafish in control, wt, mut, and wt + mut groups photographed in white light at 48 hpf. (C–F) Statistical graphs of touch-tail escape experiments, body length, brain size, and brain size/body length data for zebrafish in control, wt, mut, and wt + mut groups. *p < 0.05, **p < 0.01, ***p < 0.001, and ****p < 0.0001 vs. the control group. ▲p < 0.05, ▲▲p < 0.01, ▲▲▲p < 0.001, and ▲▲▲▲p < 0.0001 vs. the wt + mut group.