
|
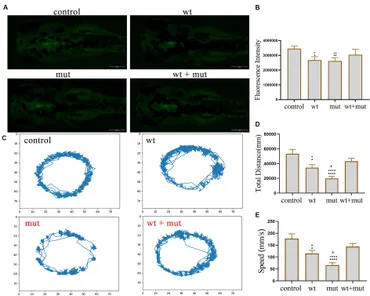
Fig. 4 Effects of ATP1A3 gene on dopamine neuron development and behavioral trajectory of zebrafish. (A) Representative graphs of dopamine neuron fluorescence in the brain of zebrafish at 72 hpf in control, wild-type ATP1A3 overexpression (wt), ATP1A3 c.823G > C mutation overexpression (mut), and rescue (wt + mut) groups. (B) Statistical graphs of the dopamine neuron fluorescence area in the brain of zebrafish in control, wt, mut, and wt + mut groups. (C) Representative graphs of the behavioral trajectories of each group of zebrafish as they developed to 120 hpf. (D,E) Statistical graphs of the data on the swimming distance and average swimming speed of zebrafish in each group. *p < 0.05, **p < 0.01, ***p < 0.001, and ****p < 0.0001 vs. the control group. ▲p < 0.05, ▲▲p < 0.01, ▲▲▲p < 0.001, and ▲▲▲▲p < 0.0001 vs. the wt + mut group. #p < 0.05 vs. the wt group.