
Image
|
Figure Caption
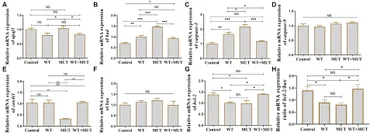
Fig. 7 Effects of the ATP1A3 gene on apoptosis-associated genes in zebrafish. (A-H) Relative mRNA expression of apoptosis-associated genes in each group of zebrafish when they developed to 120 hpf. WT, wild-type ATP1A3 overexpression group; MUT, ATP1A3 c.823G>C mutation overexpression group; WT+MUT, rescue group. NS, not significant, *p < 0.05, **p < 0.01, and ***p < 0.001.
Acknowledgments
This image is the copyrighted work of the attributed author or publisher, and
ZFIN has permission only to display this image to its users.
Additional permissions should be obtained from the applicable author or publisher of the image.
Full text @ Front. Neurosci.