
Fig. 2
- ID
- ZDB-FIG-240815-15
- Publication
- Ruan et al., 2024 - In vitro study of ATP1A3 p.Ala275Pro mutant causing alternating hemiplegia of childhood and rapid-onset dystonia-parkinsonism
- Other Figures
- All Figure Page
- Back to All Figure Page
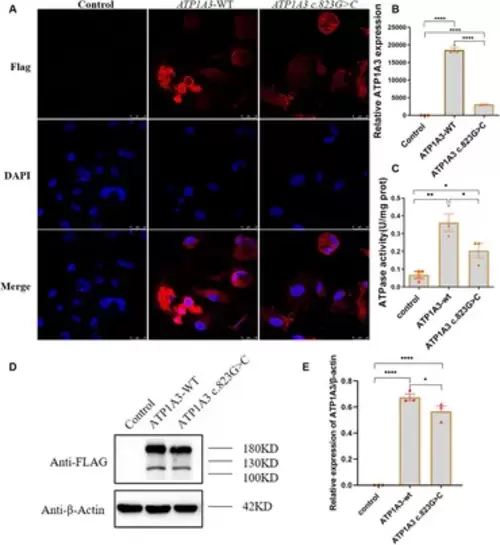
Effect of the c.823G > C mutation on ATP1A3 gene expression and Na+/K+-ATPase activity in cells. (A) Immunofluorescence detection of ATP1A3 protein expression and localization in cells carrying the unloaded (control), wild-type (ATP1A3-WT), and ATP1A3 c.823G > C mutants. ATP1A3 protein was mainly distributed in the cytoplasm, and the expression of ATP1A3 protein was weaker in cells after the c.823G > C mutation compared with the ATP1A3-WT group, but the localization of ATP1A3 protein after the mutation was not significantly different from that of the ATP1A3-WT group. (B) RT-qPCR showed that the mRNA level of ATP1A3 in cells after c.823G > C mutation was significantly lower than that in the ATP1A3-WT group. (C) The Na+/K+-ATPase activity was up-regulated in the cells of both ATP1A3-WT and ATP1A3 c.823G > C groups compared to the control group, but the Na+/K+-ATPase activity was decreased in the cells after the c.823G > C mutation compared to the ATP1A3-WT group. (D) Using an anti-Flag antibody against Flag-tagged ATP1A3 protein, the expression of Flag-ATP1A3 protein in cell lysates of control, ATP1A3-WT, and ATP1A3 c.823G > C groups was detected by western blot (WB). The WB quantification data are shown in (E). Data are presented as mean ± SEM, N = 3; NS, not significant, *p < 0.05, **p < 0.01, ***p < 0.001, and ****p < 0.0001. |