
- Title
-
Gata6 functions in zebrafish endoderm to regulate late differentiating arterial pole cardiogenesis
- Authors
- Sam, J., Torregroza, I., Evans, T.
- Source
- Full text @ Development
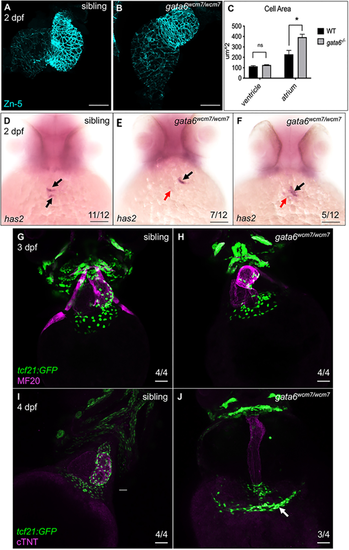
Loss of gata6 impairs heart morphology. (A-C) Atrial cardiomyocytes (CMs) are enlarged in gata6wcm7/wcm7 hearts. (A) Immunostaining of dissected wild-type (A) or gata6 mutant (B) hearts showing expression of the cell membrane marker Zn-5. The size of the atrial chamber in gata6 mutants is noticeably extended compared with wild type. Scale bars: 50 µm. (C) Quantification of cell area showed a significant increase in atrial but not ventricular CM cell area in gata6 mutant embryos (paired t-test, *P<0.05). The area of 10 random cells from each chamber was quantified from three different hearts for each genotype. Data are mean±s.e.m. (D-F) Loss of gata6 impairs atrioventricular canal (AVC) development. Whole-mount in situ hybridization staining revealed decreased expression of has2 transcripts in gata6 mutant hearts (E,F) compared with siblings (D). Arrows indicate normal (black) or much reduced (red) mRNA expression level in the AVC. Scale bars: 100 µm. (G-J) gata6wcm7/wcm7 epicardial cells fail to migrate across the myocardium. Immunostaining indicated successful migration of tcf21:GFP+ epicardial cells at the base of the ventricular myocardium of sibling (G) and gata6 mutant (H) hearts at 3 dpf. Subsequently, at 4 dpf, imaging revealed tcf21:GFP+ cells covering the sibling ventricles (I) but clustering mostly near the venous pole of gata6wcm7/wcm7 hearts (J). White arrow indicates the area of cell accumulation. Scale bars: 50 µm. |

Cardiac progenitor specification is unaffected in gata6 mutants. (A,B) Immunostaining of 33 hpf nkx2.5:ZsYellow sibling (A) or gata6 mutant (B) embryos indicated normal formation of cardiac precursors (dorsal view). Scale bars: 50 µm. (C-E) The gata6 mutant hearts exhibit small but insignificant accumulation of Nkx2.5:ZsYellow progenitors within pharyngeal arch 2. Representative images of the 2nd pharyngeal arch (white arrows) in 30 hpf Tg(nkx2.5:ZsYellow) sibling (C) or gata6−/− (D) embryos. Scale bars: 20 μm. (E) Quantification of the area of ZsYellow expression within the 2nd arch indicates a slight increase in ZsYellow+ cells in gata6 mutants compared with siblings (ns, not significant by paired t-test, data are mean±s.e.m.). Area of signal was quantified by threshold using FIJI software. |
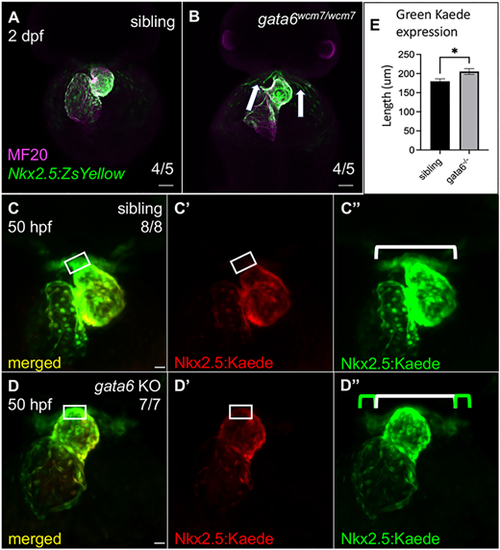
Loss of gata6 impairs the addition of Nkx2.5+ progenitors to the arterial pole. (A,B) Immunostaining at 2 dpf (frontal view) shows Nkx2.5:ZsYellow+ progenitors within and surrounding the heart in both siblings and mutants. Excess ZsYellow+ cells remain proximal to the ventricle in the mutants (white arrows). Scale bars: 50 µm. (C-D″) Representative confocal images of 50 hpf Tg(nkx2.5:kaede) embryos after photoconversion of the heart tube at 25 hpf. Tg(nkx2.5:kaede); gata6−/− embryos express more unconverted Kaede protein (D″, green bar) around the arterial pole compared with wild type or heterozygous siblings (C″, white bar, also shown in D″ for comparison). White rectangles indicate the region of cardiac cells at the arterial pole that are green+/red− (late differentiating) in sibling hearts and green+/red+ (early differentiating) in mutant hearts. Scale bars: 20 μm. (E) Quantification of the green Kaede region expressed outside the heart as marked in C″ and D″ showing significantly more cardiac cells accumulated around (but not on) the ventricle in mutants compared with siblings (paired t-test, *P<0.05, data are mean±s.e.m.). Length was measured manually using FIJI software. |
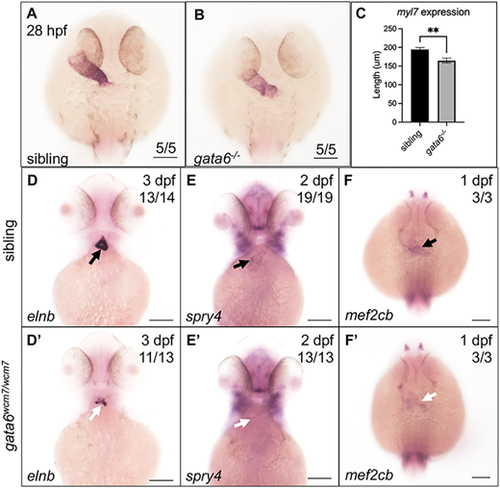
Loss of gata6 causes defects in both linear heart size and regulation of anterior secondary heart field progenitor phenotype. (A-C) Representative whole-mount in situ hybridization images of 28 hpf gata6 sibling (A) and mutant (B) embryos analyzed with a probe targeting myl7. Scale bars: 100 μm. (C) Quantification of the length of the heart tube showed a significant reduction in the length of the myl7 expression domain in gata6-null embryos compared with siblings (paired t-test, P<0.01, data are mean±s.e.m.). Length was measured manually using FIJI software. (D-F′) Whole-mount in situ hybridization analysis revealed decreased expression levels of the outflow tract marker elnb (D,D′), and SHF markers spry4 (E,E′) and mef2cb (F,F′) from 1-3 dpf in gata6 mutant larvae compared with siblings. White arrows indicate areas of reduced mRNA expression levels in the mutants. Black arrows indicate areas of normal expression in the controls. Scale bars: 100 µm. |
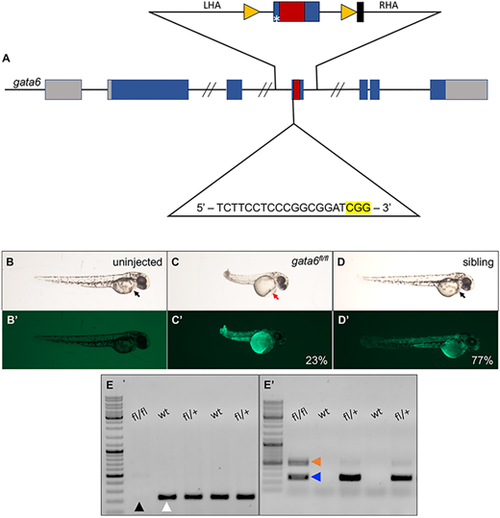
Generation of a floxed gata6 zebrafish allele. (A) Schematic showing insertion of loxP sites flanking exon 4 of the gata6 locus on chromosome 2. The middle line represents the gene, with rectangles as exons, and blue indicates the coding sequence, with intronic sequences not shown between the forward slashes. Gray boxes represent non-coding exon sequences. Sequences encoding the C-terminal zinc-finger DNA-binding domain are indicated in red. The upper line represents the donor oligomer including both left (LHA) and right (RHA) homology arms. Yellow triangles represent loxP sites and the black box represents the barcode. The asterisk indicates a base change to block gRNA interaction with the donor sequence. On the lower line, text represents the guide sequence with the PAM site highlighted in yellow. (B-D′) Microscopy images of 2 dpf progeny from an in-cross of gata6fl/+ adults harboring the TgBAC(ubb:loxP-TagBFP-STOP-loxP-EGFP)vcc18 allele, after injection of Cre mRNA at the one-cell stage. (B,C,D) Bright-field images show normal development in uninjected (B) and sibling embryos (D, black arrows). Injection of Cre mRNA results in pericardial edema (red arrow) in the gata6fl/fl embryo (C). (B′,C′,D′) GFP fluorescence showing successful excision of the TgBAC(ubb:loxP-TagBFP-STOP-loxP-EGFP)vcc18 reporter (C′,D′) compared with GFP-negative uninjected controls (B′). (E,E′) Representative example of genotyping 2 dpf whole embryos after Cre mRNA injection. (E) PCR screening for gata6fl/fl embryos using the 7991/7992 primer pair showing the presence (white arrowhead) or absence (black arrowhead) of the band corresponding to the wild-type gata6 allele. (E′) PCR screening for gata6fl/fl excision using the 7786/7787 primer pair showing bands corresponding to excised floxed alleles (blue arrowhead). In this particular gata6fl/fl embryo, some residual unexcised genomic DNA remains (orange arrowhead). |
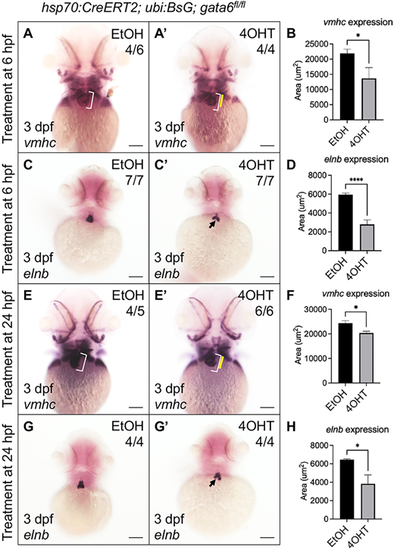
Gata6 regulates the addition of late differentiating cardiomyocytes. (A-D) Hsp70:CreERT2; ubb:BsG; gata6fl/fl embryos phenocopy gata6wcm7/wcm7 cardiac defects. Whole-mount in situ hybridization (WISH) analysis revealed decreased expression domains of both vmhc (A,A′) and elnb (C,C′) transcripts in gata6fl/fl embryos after tamoxifen treatment at 6 hpf. (B,D) Quantification of the area of WISH staining showed a statistically significant loss of the mRNA expression domain within the ventricle (B) and outflow tract (D) (paired t-test, *P<0.05 and ****P<0.0001). Data are mean±s.e.m. (E-H) Relatively late removal of gata6 by heat-shock at 24 hpf still results in reduced cardiac tissue. WISH staining showed decreased expression domains of vmhc (E,E′) and elnb transcripts (G,G′) in gata6fl/fl embryos after tamoxifen treatment at 24 hpf. (F,H) Quantification of the area of WISH staining in the ventricle (F) and outflow tract (H) (paired t-test, *P<0.05). Data are mean±s.e.m. Scale bars: 100 µm. White brackets indicate the length of the ventricle in ethanol-treated controls. Yellow bars indicate the length of the ventricle in tamoxifen-treated embryos. Black arrows indicate the reduced area of elnb expression. Area of staining was measured manually using FIJI software. |
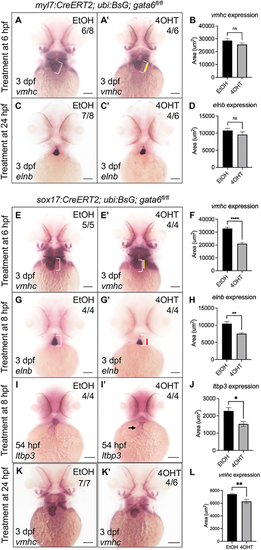
Loss of endodermal but not myocardial gata6 expression disrupts development of the anterior secondary heart field. (A-D) Loss of myocardial gata6 does not significantly impair cardiac development. Whole-mount in situ hybridization (WISH) staining showed no significant difference in vmhc (A,A′) or elnb (C,C′) expression domains in gata6fl/fl embryos after ethanol or tamoxifen treatment at 6 hpf or 24 hpf, respectively. White brackets indicate the length of the ventricle in ethanol-treated controls. Yellow bar indicates the length of the ventricle in tamoxifen-treated embryos. (B,D) Quantification of the area of WISH staining (paired t-test; ns, not significant). Data are mean±s.e.m. (E-H) Loss of endodermal gata6 disrupts cardiac morphogenesis. (E,E′) WISH analysis for vmhc expression pattern in gata6fl/fl embryos revealed a notable reduction in the size of the ventricle after tamoxifen treatment at 6 hpf. White brackets indicate the length of the ventricle in ethanol-treated controls. Yellow bar indicates length of ventricle in tamoxifen-treated embryos. (G,G′) WISH analysis for elnb transcript patterns revealed shortened outflow tracts in gata6fl/fl hearts after tamoxifen treatment at 8 hpf. White brackets indicate the length of the outflow tract in ethanol-treated controls. Red bar indicates the length of the outflow tract in tamoxifen-treated embryos. (F,H) Quantification of the area of WISH staining confirmed a significant loss of expression domain within the heart (F) and outflow tract (H) (paired t-test, ****P<0.0001 and **P<0.005, respectively). Data are mean±s.e.m. (I,I′) Loss of endodermal gata6 reduces ltbp3 expression levels. WISH analysis revealed decreased expression domain of ltbp3 transcripts in tamoxifen-treated gata6fl/fl embryos (I′) compared with ethanol-treated controls (I). Black arrow indicates reduced expression of ltbp3 within the ventricle. (J) Quantification of WISH staining showed a significant reduction in the area of ltbp3 mRNA expression within the heart (paired t-test, *P<0.05). Embryos were treated overnight starting at 8 hpf. (K-L) Late removal of endodermal gata6 impairs ventricular chamber development. Representative WISH images of 3 dpf Tg(sox17:CreERT2); Tg(ubb:BsG); gata6fl/fl embryos after exposure to ethanol (K) or 10 μM tamoxifen (K′) from 24 hpf to 48 hpf analyzed with probes targeting vmhc. (L) Quantification of the area of vmhc expression showed a significant reduction in tamoxifen-treated embryos compared with control (paired t-test, **P<0.01, data are mean±s.e.m.). Scale bars: 100 µm. Area of staining was measured manually using FIJI software. |
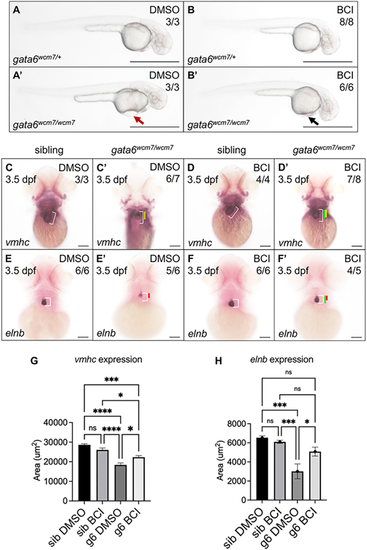
BCI treatment partially rescues cardiac defects in gata6wcm7/wcm7 mutants. (A-B′) Bright-field images of 2 dpf gata6 mutant and sibling embryos exposed to DMSO (A,A′) or 7.5 µM BCI (B,B′) for 6 h starting at the 15-somite stage. Pericardial edema is essentially eliminated in BCI-treated mutants (B′, black arrow) compared with DMSO-treated controls (A′, red arrow). Scale bars: 1000 µm. (C-F′) Whole-mount in situ hybridization (WISH) analysis revealed largely restored expression domains of vmhc (D′) and elnb (F′) in gata6 mutants after overnight exposure to BCI starting at the 15-somite stage (compare C′ and E′, respectively). White bars indicate the normal length of the ventricle or outflow tract in DMSO-treated siblings. Yellow (C′,D′) and red (E′,F′) bars indicate shortened length in the DMSO-treated mutants. Green bars indicate restored length after overnight exposure to BCI. Scale bars: 100 µm. (G,H) Quantification of WISH staining confirmed a statistically significant increase in the area of vmhc and elnb expression domains with BCI treatment (one-way ANOVA, *P<0.05, ***P<0.001 and ****P<0.0001). Data are mean±s.e.m. |