
- Title
-
Cxcr4a regulates heart progenitor development and cardiac rhythm in zebrafish
- Authors
- Chen, B., Ran, Q., Chen, X., Deng, Z., Zhou, R., Zhang, Y., Liu, M., Li, B., Huang, S., Wang, P., Huang, S.
- Source
- Full text @ Biochem Biophys Rep
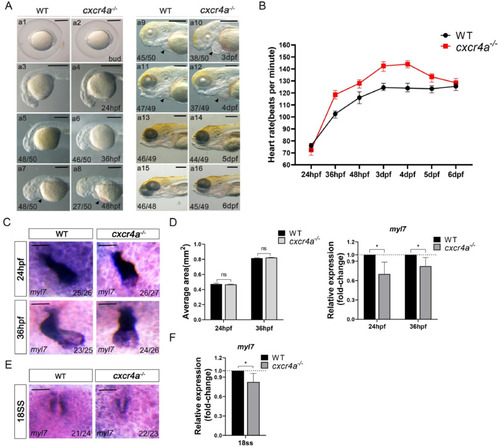
Cardiac development is disturbed in the cxcr4a−/− embryos. (A) Comparing the wild-type (WT) and cxcr4a−/− embryos from bud stage to 6 dpf. The mutants display pericardial effusion and erythrocyte remaining from 2dpf to 4dpf (black arrow showed). However, the development of head and eyes are normal. (B) Knocking out cxcr4a increases the heart rate from 36hpf to 5dpf. The data represents average heart rate. Error bars indicate standard deviation of the mean. Unit: beats per minute. (C, D) The embryonic heart in cxcr4a−/− embryos is deformed, displaying defect heart jogging (C). But the heart size is normal (D). The expression of myl7 is examined using RT-qPCR and it is decreased in cxcr4a mutants at 24hpf and 36hpf when compared with WT embryos (D). (E, F) At 18 SS, the expression of myl7 is examined using in situ experiments and RT-qPCR, the expression of myl7 is decreased. Error bars indicate standard deviation of the mean. ns: not significant. Bar in image A, 50 μm; Bar in image C and E, 20 μm *P<0.05. |
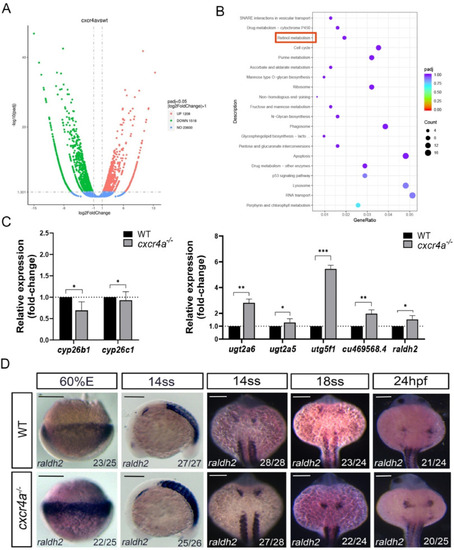
RA signaling pathway is up-regulated in cxcr4a mutants (A) Volcano map of genes expressed differently between control embryos and cxcr4a mutant embryos. The up-regulated genes are indicated by red dots and down-regulated genes by green dots. (B) KEGG rich distribution map. The retinol metabolism pathway is also disturbed, which is marked by red box. (C) The genes being involved in RA signaling are evaluated using qRT-PCR. In cxcr4a mutants cyp26b1 and cyp26c1 are down-regulated and ugt2a5, ugt2a6, ugt5f1, cu469568.4 and raldh2 were all up-regulated. (D) The expression of raldh2 is examined using in situ hybridization at 60 % epiboly, 14SS, 18SS and 24hpf, it is up-regulated at all stages in cxcr4a mutants. Error bars indicate standard deviation of the mean. Bar, 50 μm *P<0.05; **P<0.01; ***P<0.001. (For interpretation of the references to colour in this figure legend, the reader is referred to the Web version of this article.) |
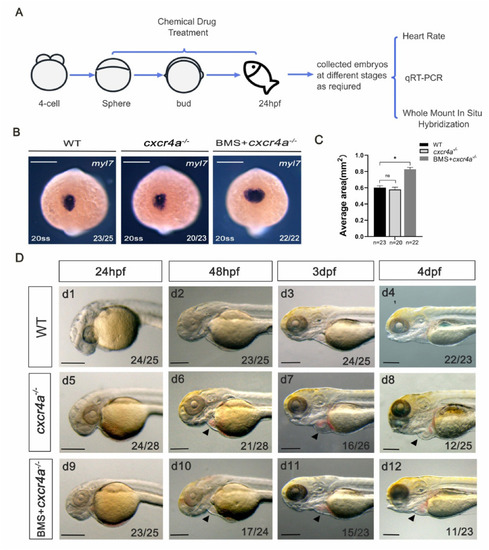
Treatment with BMS partially rescues the heart phenotype in cxcr4a−/− embryos (A) Experimental designing for BMS treatment and the subsequent experiments. (B) Expression of myl7 in wild-type embryos, cxcr4a−/− embryos and cxcr4a−/− embryos treated with BMS (0.04 μM) from 4hpf to 20hpf. The dowregulation of myl7 expression in cxcr4a mutants is restored after treating with BMS. (C) The area of myl7 expression is increased in cxcr4a mutants after treating with BMS. (D) BMS treatment partially rescues pericardial effusion and erythrocyte remaining in cxcr4a mutants (Dd10-Dd12, black arrow head showed). Error bars indicate standard deviation of the mean. Bar, 50 μm *P<0.05. |
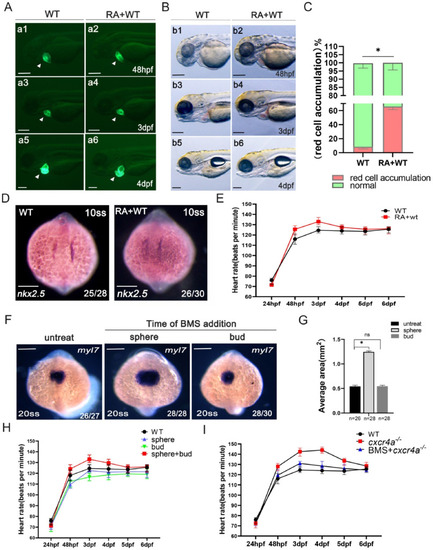
Up regulation of RA may result in increased heart rhythm in cxcr4a mutants (A, B) Tg(cmlc2: GFP) transgenic embryos are treated with DMSO (as control) or low dose of RA (10−9 M) from 4hpf to 24hpf, no distinct heart size is showed from 48hpf to 4dpf (A), but some of embryos display mild pericardial effusion and erythrocyte remaining (B). (C) Statistical analysis for the embryos displaying erythrocyte remaining in 3 dpf after treating with low dose of RA. (D) In situ hybridization of nkx2.5 at 10SS in embryos treated with low dose of RA, showing the expression of nkx2.5 is mild down-regulated (E) Embryos treated with low dose of RA display mild rapid heart rate. (F) Expression of myl7 shows that RA treatment restricts progenitor cells during gastrula. (G) Statistical map for the area of myl7 expression. (H) Heart rate in embryos treated with low dose of RA according to different time windows (sphere to bud, bud to 24hpf, or sphere to 24hpf). It indicates that, from sphere to 24hpf, all the stages are required when RA regulating heart rhythm in zebrafish. (I) BMS treatment partially rescues hear rate in cxcr4a−/− embryos. In C, Error bars indicate standard deviation of the mean. *P<0.05. In E, H and I, Line chart graphs represent average heart rate. Error bars indicate standard deviation of the mean. Unit: beats per minute. Bar, 50 μm. |