
- Title
-
Somatostatin signalling coordinates energy metabolism allocation to reproduction in zebrafish
- Authors
- Chen, J., Zhao, W., Cao, L., Martins, R.S.T., Canário, A.V.M.
- Source
- Full text @ BMC Biol.

Growth, fecundity and breeding efficiency of sst1.1 and sst1.2 deficient zebrafish and their wild-type siblings. a sst1.1+/+ and sst1.1−/− linear and ponderal growth (n=23 to 32 per time point) under normal feeding showing the mutants significantly longer than wild-type only at 60 days. b sst1.2+/+ and sst1.2−/− linear and ponderal growth (n=22 to 34 per time point) under normal feeding showing the mutants significantly longer than wild-type only at 55 days. c Left, the number of eggs per clutch spawned every 3–5 days by sst1.1+/+ and sst1.1−/− zebrafish under normal and ad libitum feeding, with mutants fed ad libitum spawning significantly fewer eggs than wild type; Right, Breeding efficiency of sst1.1+/+ and sst1.1−/− zebrafish under normal and ad libitum feeding, with mutants fed ad libitum having significantly lower breeding efficiency than wild type. d Left, number of eggs per clutch spawned every 3-5 days by sst1.2+/+ and sst1.2−/− zebrafish under normal and ad libitum feeding, with mutants under normal and ad libitum feeding spawning significantly more eggs than wild type; Right, Breeding efficiency under normal and ad libitum feeding with mutants under normal and ad libitum feeding having significantly higher breeding efficiency than wild type. Data are shown as mean ± standard error of the mean |
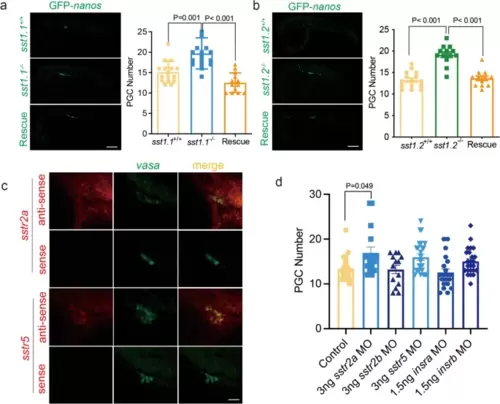
Visualisation and counting of PGCs in the gonad of 24 hpf zebrafish embryos. a Left visualisation of PGCs in embryos injected with GFP-nos1 3′UTR capped mRNA in (top) sst1.1+/+, (middle) sst1.1−/−, and (bottom) in sst1.1−/− rescued by co-injection with sst1.1 mRNA. Right, histograms show that sst1.1−/− developed 26.7% more PGCs than sst1.1+/+, and the rescue brought PGC numbers down to sst1.1+/+ levels. b Left, visualisation of PGCs in embryos injected with GFP-nos1 3′UTR capped mRNA in (top) WT (sst1.2+/+), (middle) sst1.2−/−, and (bottom) in sst1.2−/− rescued by co-injection with sst1.2 mRNA. Right, sst1.2−/− developed 45% more PGCs than sst1.2+/+, and the rescue brought PGC numbers down to sst1.2+/+ level. c Fluorescence in situ hybridisation of PGCs showing diffuse expression of sstr2a and sstr5 and their co-expression with vasa in germ cells (column merge). In the bottom panels, RNA sense probes have no staining. d Number of PGCs in WT embryos injected with GFP-nos1 3′UTR capped mRNA (control) and MO of SST (sstr) or insulin (insr) receptors showing significantly increased PGC numbers only in the sstr2a-MO. Data are shown as mean ± standard error of the mean |
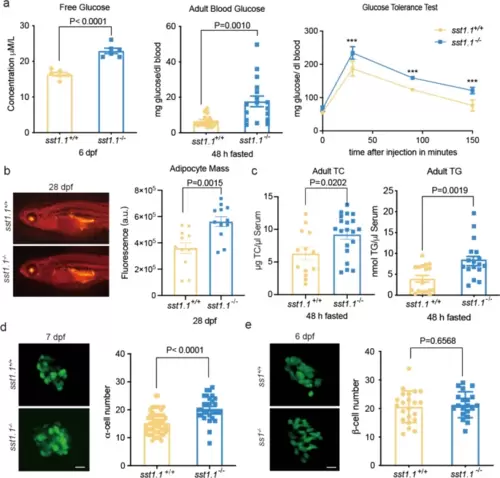
Metabolic characteristics of the sst1.1−/− mutant under normal feeding. a The sst1.1−/− mutant had higher glucose levels than sst1.1+/+ in both (left) whole larvae and (centre) adult blood, as well as (right) decreased glucose clearance; Additional file: Table S2; *** P<0.001. b Left, Nile red staining fluorescence and (right) the corresponding histogram of fluorescence optical density showing the sst1.1−/− mutant had more visceral fat than WT. c The sst1.1−/− mutant had lower blood total cholesterol and higher triglyceride than WT. d Crossing the sst1.1−/− mutant with a Tg(gcg:GFP) zebrafish line allowed (left) visualisation and (right) counting of α-cells to establish that Sst1.1 deficiency caused α-cell proliferation. e Crossing the sst1.1−/− mutant with a Tg(-1.2ins:GFP) zebrafish line (left) allowed visualisation and (right) counting of β-cells to establish that there was no effect of Sst1.1 deficiency on the β-cell number. Data are shown as mean ± standard error of the mean |
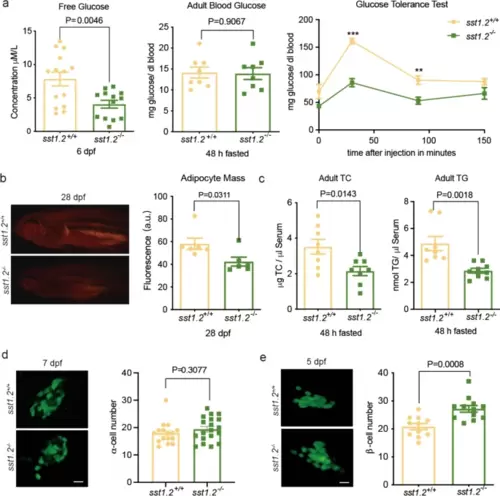
Metabolic characteristics of the sst1.2−/− mutant under normal feeding. a Left, the sst1.2−/− mutant larvae had lower glucose content than WT, but there were no differences in adult mutant and WT blood glucose. Right, Adult sst1.2−/− mutant had greater glucose clearance than WT; Additional file: Table S2, *** P<0.001, ** P<0.01. b Left, Nile red staining fluorescence and (right) the corresponding histogram of fluorescence optical density showing the sst1.2−/− mutant had less visceral fat than WT. c Left, the sst1.2−/− mutant also had lower blood total cholesterol and (right) triglyceride than WT. d Left, crossing the sst1.2−/− mutant with a Tg(gcg:GFP) zebrafish line allowed visualisation and counting of α-cells (right) and established that sst1.2 deficiency did not affect α-cell proliferation. e Crossing the sst1.2−/− mutant with a Tg(-1.2ins:GFP) zebrafish line allowed (left) visualisation and (right) counting of β-cells to establish that sst1.2 deficiency caused β-cell proliferation. Data are shown as mean ± standard error of the mean |