
|
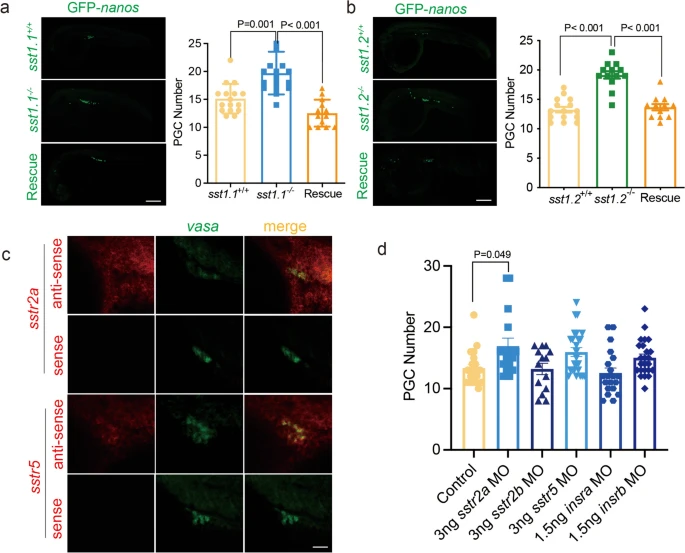
Fig. 2 Visualisation and counting of PGCs in the gonad of 24 hpf zebrafish embryos. a Left visualisation of PGCs in embryos injected with GFP-nos1 3′UTR capped mRNA in (top) sst1.1+/+, (middle) sst1.1−/−, and (bottom) in sst1.1−/− rescued by co-injection with sst1.1 mRNA. Right, histograms show that sst1.1−/− developed 26.7% more PGCs than sst1.1+/+, and the rescue brought PGC numbers down to sst1.1+/+ levels. b Left, visualisation of PGCs in embryos injected with GFP-nos1 3′UTR capped mRNA in (top) WT (sst1.2+/+), (middle) sst1.2−/−, and (bottom) in sst1.2−/− rescued by co-injection with sst1.2 mRNA. Right, sst1.2−/− developed 45% more PGCs than sst1.2+/+, and the rescue brought PGC numbers down to sst1.2+/+ level. c Fluorescence in situ hybridisation of PGCs showing diffuse expression of sstr2a and sstr5 and their co-expression with vasa in germ cells (column merge). In the bottom panels, RNA sense probes have no staining. d Number of PGCs in WT embryos injected with GFP-nos1 3′UTR capped mRNA (control) and MO of SST (sstr) or insulin (insr) receptors showing significantly increased PGC numbers only in the sstr2a-MO. Data are shown as mean ± standard error of the mean